


INTRODUCTION
Diabetes is a chronic metabolic disease that affects approximately 422 million people worldwide and leads to the death of 1.5 million people every year [1]. The prevalence of diabetes among the population aged 30 or older in Korea has steadily increased since 2018, reaching 16.7% in 2020, with one in six adults having diabetes. Particularly, the disease recognition and treatment rates for people with diabetes are 65.8% and 61.4%, respectively, indicating a need for improvements in diabetes management [2].
Diabetes is characterized by elevated blood sugar levels, which, over time, cause serious damage to the heart, blood vessels, eyes, kidneys, and nerves [3]. The causes of diabetes include old age, obesity, stress, unhealthy eating habits, lack of exercise, and drug use. Obesity is the major cause of type 2 diabetes mellitus. Obesity activates inflammatory cells and causes diabetes due to insulin resistance [4]. Studies from the Multi-Ethnic Study of Atherosclerosis (MESA) and National Health and Nutrition Examination Survey (NHANES) found that obesity was associated with 30%-53 percent of new diabetes cases in the United States each year [5]. Additionally, obese people are almost three times more likely to develop type 2 diabetes than non-obese people [5]. In Korea, half of diabetic patients are obese [6].
When diabetes is accompanied by obesity, the prevalence of diabetes-related microvascular and macrovascular complications, as well as mortality, also increases [7]. Managing obesity not only prevents the progression to pre-diabetes or diabetes, but also improves blood sugar control in diabetic patients and reduces the need for diabetes medications [8-10].
The prevalence of overweightness and obesity is rapidly increasing. The World Health Organization reported that obesity has increased almost three-fold since 1975, and in 2016, 39% of adults aged 18 years or older were overweight and 13% were obese [11]. According to the 2017- 2018 NHANES data, 30.7% of U.S. adults were overweight and 42.4% were obese. The prevalence of obesity in Korea is 38.3%, and is higher in men (48.0%) than in women (27.7%). Given the strong correlation between diabetes and obesity, managing overweight and obesity in patients with diabetes is an important strategy for providing comprehensive and optimal treatment for patients with diabetes.
Diet, exercise therapy, and behavioral modifications play central roles in lifestyle interventions for weight loss in patients [12]. In recent years, research on the psychosocial factors that influence the implementation of these interventions has received increasing attention. Previous studies have reported that perceptions of overweight and body image are associated with weight control behaviors and forms of obesity management [13,14]. Additionally, a study targeting obese people reported that the main factor influencing weight control behavior was not objective Body Mass Index (BMI) but subjective body shape perception [15]. However, limited research has been conducted on how weight perception affects weight loss efforts in OOPD. Therefore, this study aimed to analyze weight perception and related factors, and identify factors that influence weight loss efforts among OODP in Korea.
METHODS
Participants
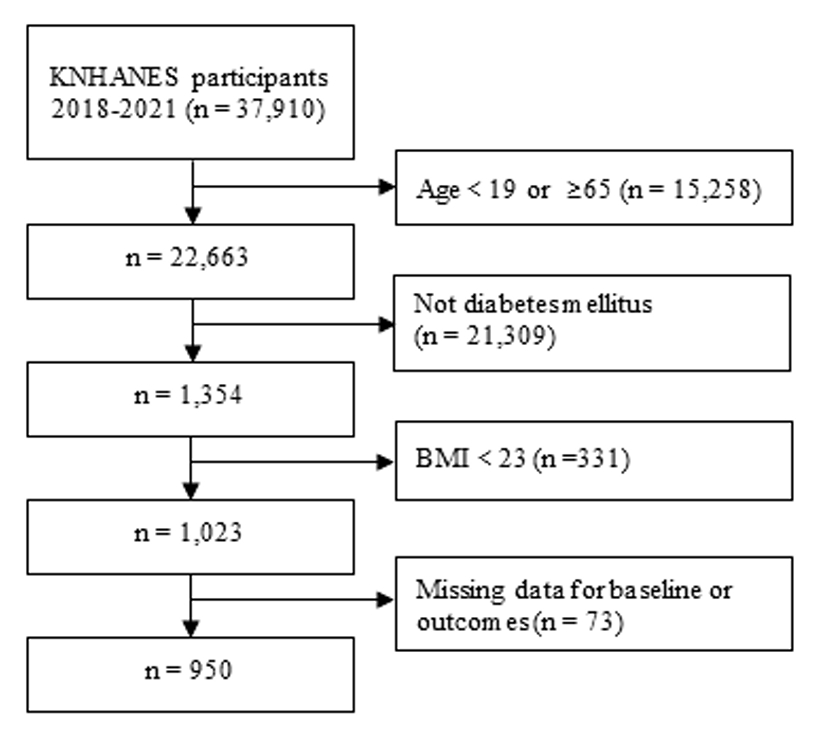
This study used raw data from the Korea National Health and Nutrition Examination Survey (KNHNES) between 2018 and 2021. First, of a total of 37,910 subjects, 1,354 adult patients aged 19−64 were extracted. Next, 1,023 individuals with a BMI of 23 or higher were selected. Finally, 950 participants were selected, excluding 73 with missing values for the variables (Figure 1).
Investigations
Socioeconomic characteristics included age, sex, educational level, household income, economic activity, marital status, smoking status, and alcohol consumption. Age was divided into 19−29, 30−39, 40−49, 50−59, and 60−64 years. Educational level was classified as elementary school graduation or lower, middle school graduation, high school graduation, or college graduation or higher. Household income was classified into low, low-middle, upper-middle, and high based on the household and economic activity section of the KNHNES. Marital status was classified as married; married-no spouse due to divorce, separation, or widowhood; and unmarried. Smoking was classified as current smoker, ex-smoker, or none. Alcohol consumption was classified as high-risk drinker (drinking more than twice a week), normal drinker, or none.
Disease morbidity included hypertension, dyslipidemia, stroke, and cardiovascular disease. Those who were diagnosed by a doctor in the morbidity section of the health survey were defined as having the disease. According to the Asia-Pacific standards set by the International Obesity Task Force and the guidelines of the Korean Society of Obesity, overweight has a BMI of 23.0 to 24.9 kg/m2, Class 1 obesity is 25.0 to 29.99 kg/m2, and Class 2 obesity is 30.0 to 34.9. 9 kg/m2, and Class 3 obesity was classified as 35.09 kg/m2 or more [16]. Regarding weight perception, in the examination section, to the question “What do you think of your current body type is?” those who selected ‘very thin,’ ‘slightly thin,’ or ‘average’ were classified as normal weight perception and those who selected ‘slightly obese’ or ‘very obese’ were classified as overweight. Weight loss efforts were defined as those who chose ‘weight loss efforts’ when asked “Have you ever tried to control your weight on your own during the past year?”
Statistical analysis
As the KNHNES is a complex sample survey, it was analyzed by applying stratification variables, cluster variables, and weights. Weight perception status according to socioeconomic characteristics and disease morbidity was compared using the chi-square test. Differences in weight perception and weight loss efforts according to sex were also confirmed through cross-analysis. Logistic regression analysis was conducted to identify factors affecting weight loss. Unadjusted and adjusted analyses for socioeconomic characteristics and disease morbidity were performed. Statistical analyses were performed using IBM SPSS ver. 24.0 (IBM Co., Armonk, NY, USA) was used, and the level of statistical significance was defined as P value of less than 0.05.
Ethical consideration
The KNHNES was conducted under the approval of the Institutional Review Board (2018-01-03-P-A) of the Korea Disease Control and Prevention Agency (KDCPA). In compliance with the Personal Information Protection Act and the Statistics Act, the KDCPA provides only de-identified data. Individuals cannot be inferred from survey data, which can be downloaded from the KNHNES website [17].
RESULTS
Socioeconomic characteristics
Among 1,354 adult patients aged 19−64, 1,023 (75.6%) were identified as overweight or obese. From the selected 950 subjects, 57.8% were men and 42.2% were women. The majority (39.2 %) fell within the 50s age group. Regarding the level of education, 37.5% had a high school diploma and 30.1% reported a high family income. Among the participants, 67.7% were economically active and 77.2% were married. Class 1 obesity was the most prevalent BMI category, accounting for 53.8%.
Weight perception
The proportion of participants with normal weight perception was 24.4%, significantly higher in men (29.6%) than in women (14.6%) (p < 0.001). Additionally, weight perception showed statistically significant differences across age groups (p = 0.024), smoking status (p = 0.002), and dyslipidemia status (p = 0.045). When categorized by BMI, the perception of normal weight varied as follows: overweight (58.6%), class 1 obesity (12.3%), class 2 (0.8%), and class 3 (0.0%) (p < 0.001). In particular, among overweight participants, normal-weight perception (58.6%) was higher than the overweight perception (41.4%). There was a significant difference in weight loss efforts, with 10.8% of those perceiving themselves as normal weight and 89.2% perceiving themselves as overweight perception. (p <0.001) (Table 1).
When analyzing weight loss efforts stratified by sex and weight perception, women’s efforts were higher than those of men in both the normal weight and overweight perception groups, although this difference was not statistically significant (Figure 2).
Factors associated with weight loss efforts
Logistic regression analysis revealed that weight perception was the most important predictor of weight loss efforts (p < 0.001), followed by dyslipidemia (p = 0.022). After adjusting for socioeconomic characteristics and disease morbidity, individuals perceiving themselves as overweight were 5.11 times (95% CI: 3.02 - 8.66) more likely to attempt weight loss than those perceiving themselves as normal weight. Additionally, the rate of weight loss efforts was 1.54 times (95% CI: 1.06 - 2.25) higher among individuals with dyslipidemia than in those without dyslipidemia (Table 2).
DISCUSSION
This study utilized data from the 2018-2021 KNHNES to analyze self-perceptions of weight and identify factors that influence weight loss efforts among overweight or obese patients with diabetes. The prevalence of overweight or obesity among adult patients with diabetes aged 19-64 years was 75.6%, surpassing the 57.3% prevalence among adults aged 19 years and older in South Korea [18]. These results clearly indicate the prevalence of overweight or obesity among individuals with diabetes as a national health concern. Thy further support the importance of weight management in people with diabetes.
In our study, 24.4% of overweight or obese patients with diabetes perceived themselves as having a normal weight. This percentage is higher than the 12.6% [19] found in a study of obese hypertensive patients and the 15.1% [20] found in US college students. We analyzed differences in weight perception socioeconomic variables, comorbidities, and BMI and found significant results. Normal weight perception was highest among those in their 50s and 60s, and lowest among those in their 30s. The higher rate of normal weight perception in individuals in their 20s than those in their 30s may be attributed to the rapid increase in diabetes cases among individuals in their 20s in recent years. According to data from the National Health Insurance Service (NHIS), the number of patients with diabetes in their 20s has increased by approximately 12%, from 24,117 in 2017 to 37,916 in 2021. On the other hand, patients with diabetes in their 20s were the least likely to seek treatment, with only 10% visiting a doctor within a year of diagnosis, which is lower than the 20% of patients in their 30s [21]. Experts attribute the rise in diabetes among young individuals in their 20s and 30s to a lack of exercise and dietary changes [22]. Further research is needed to determine how normal weight perception is related to these lifestyles.
Normal-weight perception was higher in men than in women. However, when weight loss efforts were stratified by sex, there was no difference in weight loss efforts by sex in either the normal weight or overweight groups. This differs from the findings of Nguyen et al. [23], who reported that women’s weight loss intentions were higher than those of men in a study of people with non-alcoholic fatty liver. These findings led to the conclusion that weight loss efforts in people with diabetes may be influenced more by weight perception than sex.
A regression analysis of the factors influencing weight loss efforts revealed that weight perception was most strongly associated with weight loss efforts. Weight perception was the most important factor in both unadjusted and adjusted analyses of socioeconomic characteristics and comorbidities. Weight-related misperceptions of body size, weight, and weight status are significant global health concerns. The Health Survey for England (HSE) found that 40% of men and 19% of women underestimated their weight [24]. The NHANES found that among people with a BMI of 25 or higher, 32.8% considered themselves underweight or of the right weight [25]. A study of eight Chinese cities found that the prevalence of weight misperception was 21.3% [26]. Weight misperception can negatively affect attitudes and behaviors related to weight, leading to unhealthy physical and psychological outcomes. In particular, obese individuals who underestimate their weight are less sensitive to weight-related health risks and less likely to actively engage in weight loss behaviors [27-30]. In the present study, weight loss was 5.11 times higher among those who perceived themselves as overweight than among those who did not. This finding suggests that promoting accurate weight perception is an important component of weight management in people with diabetes.
Another interesting finding was that weight-loss efforts in patients with diabetes were associated with dyslipidemia. Diabetes is closely associated with dyslipidemia, especially hypertriglyceridemia and low high-density lipoprotein cholesterol level [31]. Cardiovascular disease (CVD) is the leading cause of death due to diabetes, and dyslipidemia is a known risk factor for CVD [32]. The finding that weight loss efforts in overweight or obese patients with diabetes were not associated with hypertension, stroke, or CVD morbidity but were associated with dyslipidemia would be of great significance for further research and intervention development. On the other hand, according to the Korean Society of Lipid and Atherosclerosis (KSLA), the prevalence of dyslipidemia among people aged 20 years and older in Korea is very high at 48.1%, but only 46% of respondents said they knew what it was, indicating that awareness of dyslipidemia is very low [33]. To maintain and manage the health of patients with diabetes, efforts to improve awareness of dyslipidemia are crucial.
The limitations of this study include surprisingly little research has been conducted on weight control approaches in overweight or obese patients with diabetes at the national level, making it difficult to compare our findings with those of other studies. Another limitation is that our study was a secondary analysis of data from the KNHNES, which may not have included significant variables related to weight management in patients with diabetes. Despite these limitations, this study provided objective results because it utilized a large sample size and rigorous quality control. It also provides information on differences in weight perceptions and weight loss efforts by socioeconomic variables such as sex, age, income, and education, as well as disease comorbidities such as hypertension, dyslipidemia, and stroke, which may be useful in improving the effectiveness of specific approaches to weight control strategies in people with diabetes.
Using data from the 2018-2021 KNHNES, we found that weight perception was the most important predictor of weight loss efforts among overweight or obese patients with diabetes in South Korea, followed by dyslipidemia. Individuals who perceived themselves as overweight were 5.11 times more likely to attempt weight loss than those who perceived themselves as normal weight, while those diagnosed with dyslipidemia were 1.54 times more likely to initiate weight loss efforts than those without. These results suggest that weight management approaches for overweight or obese patients with diabetes should be individually tailored based on weight perception and presence of dyslipidemia.