


INTRODUCTION
Bone health is an important factor in an athlete’s life and performance, and athletes with poor bone strength have higher risks of fractures [1]. Exercise strengthens the bone by increasing mechanical loading [2]. However, symptoms of the female athlete triad, such as low energy availability, have been shown to impair bone growth in young athletes [3,4]. Previous studies have confirmed that 16-24% of young athletes have low bone mineral density (BMD) [5-7]; therefore, it is necessary to address this issue in the young athletes.
In previous studies [8-13], we and other researchers have investigated the effect of a combination of running exercise and low food intake on bones in experimental animal models. Although there are differences in the type of exercise, nutritional restriction, age, and sex, these studies have found that energy restriction under exercise conditions impairs bone mass [8-10,12,13], histomorphometry [9-12], and biomechanical properties [12,13]. As mentioned previously, the correlation of exercise conditions with low food intake and the bone strength is progressing. However, the chemical properties of bones have not yet been investigated.
Raman spectroscopy can be used to examine the chemical properties (structure and composition) of the mineral and organic matrix components of bone tissue. Raman spectra of bone reveal prominent vibrational bands of organic and inorganic compounds related to bone tissue composition [14]. Raman spectroscopy can be used to assess bone quality parameters such as mineral crystallinity, mineral-to-matrix ratio, carbonate-to-phosphate ratio, and collagen crosslink maturity [14]. Mineral crystallinity, mineral-to-matrix ratio, carbonate-to-phosphate ratio, and crosslink maturity represents mineral maturation, the amount of mineralization of the collagen matrix, the extent of carbonate substitution in the mineral lattice, and collagen quality, respectively [15-18]. The discovery of these chemical properties has led to the development of more detailed assessments of bone strength and fracture risk. Although the effects of exercise on bone chemical properties have been studied using Raman spectroscopy [17,19-21], the effects of food restriction under both sedentary and exercise conditions have received little attention. Possibly, bone chemical properties are altered by decreased intake of bone materials, such as calcium and protein, and an imbalance in bone metabolism due to energy deficiency. Therefore, bone chemistry could be improved if we have a clear understanding of the characteristic changes in the bone associated with exercise at a low dietary intake.
This study aimed to investigate the effect of combination of running and food restriction on the chemical properties of bone in young female rats. Furthermore, we investigated whether the chemical property parameters correlated with the bone-breaking strength. We hypothesized that the combination of running and food restriction would impair bone chemical properties, bone breaking strength, and BMD, and that the chemical property parameters could be correlated with bone strength. We have previously reported that a combination of voluntary running exercise and food restriction reduced bone strength and mass in young female rats [13]. We recently performed Raman spectroscopic analysis of the chemical properties of the bone in these rats. Therefore, we have included our previous data [13] in this study, along with the new data on the chemical properties of bone.
METHODS
Experimental design
The experiments were conducted as described previously [13]. Briefly, after a one-week acclimatization period, female Sprague-Dawley rats (n = 32, 7 weeks old) were randomly divided into four experimental groups: sedentary and ad libitum feeding (SED, n = 8), voluntary running exercise and ad libitum feeding (EX, n = 8), sedentary and 30% food-restricted (SED-FR, n = 8), and voluntary running exercise and 30% food-restricted (EX-FR, n = 8). The experiment lasted 12 weeks. Rats were obtained from CLEA Japan (Tokyo, Japan) and fed a standard diet of 62.37% glucose monohydrate, 18.0% casein, 10.0% cottonseed oil, and other components (crude 0.6% Ca, 0.6% P), as previously described [13].
The SED and SED-FR groups were housed individually in normal cages (15 × 25 × 19.5 cm), whereas the EX and EX-FR groups were housed individually with free access to the wheel cage (circumference, 1 m; 27 × 35 × 35 cm), allowing voluntary running exercise. Voluntary running was used to assess changes in daily running distance and to maintain momentum. Notably, voluntary wheel running can be evaluated for running distance (exercise volume) but not for exercise intensity.
The SED-FR and EX-FR groups were fed a 30% restricted diet, which contained 70% of the mean amount consumed by the SED group in the previous week. Therefore, the EX-FR group was fed a diet that was 35% lower than that of the EX group (Table 1). The room temperature was maintained at 22 ± 1 °C with a constant 12:12 h light-dark cycle (light hours 8:00-20:00). The Animal Experimental Committee of the University of Tsukuba approved the animal care and experimental procedures (approval number: 11-377). All experimental protocols adhered to the Guidelines for the Care and Use of Laboratory Animals.
Daily data collection and specimen harvesting
Data collection was performed using the methods described previously [13]. Briefly, body weight and dietary intake were measured every alternate day, and the running distance was measured daily. The rats were fasted overnight at the end of the feeding period before being sacrificed under diethyl ether anesthesia. After death, the abdominal fat, uterus, femur, and tibia were collected from each rat. Both femurs were collected, the adhering connective tissues were removed, and bone strength was measured immediately. After harvesting and cleaning the soft tissue, the left tibias were stored in 70% ethanol for evaluation of BMD and chemical properties. Since one left tibia in the EX group was not collected, a total number of tibial measurements was seven.
Calculation of energy availability
The experimental design was followed as described previously [13]. Briefly, energy intake was calculated by multiplying the normal diet intake (3.73 kcal/g). Exercise-induced energy expenditure due to daily wheel running was calculated as 5.0 kcal/kg body weight times the kilometer run [22], using the formula: exercise-induced energy expenditure = wheel running distance × body weight × 5.0 kcal/kg body weight/km [8]. Energy availability was determined by subtracting energy intake from exercise energy expenditure [8]. Energy availability values are generally normalized to fatfree mass in humans [3], but were not normalized in this study because of the difficulty in analyzing fat-free mass in rats.
Evaluation of estrous cycle by spectral analysis of the running distance
The spectral analysis was performed as described previously [13] to determine whether the running distance increased every 4 or 5 days to assess the estrous cycle. If the running distance increases cyclically every 4 or 5 days, the proportion of the power spectrum from 0.2 to 0.3 Hz in the total power spectrum is high. However, in anestrous female rats, minimal fluctuations in wheel running have been reported [8]. Therefore, the power spectrum of the running distance from 0.2 to 0.3 Hz will have a low proportion in the total power spectrum in anestrous female rats.
Measurement of bone strength using a three-point bending test
A three-point bending test was used to evaluate the strength of the femoral midshaft (DYN-1255; IIO DENKI, Tokyo, Japan), as described previously [13]. The integral of the load until the breaking point was used to calculate the total breaking energy.
Measurement of BMD using dual-energy X-ray (DXA) absorptiometry
Unlike in previous reports13, the BMD of the left side of the mid-diaphysis tibia was measured using a DXA absorptiometry machine (QDR-4500A; Hologic, Bedford, MA, USA). All scans were performed in rat mode. The rat phantom BMD measurements had a 0.39% coefficient of variation. The tibia was divided into five sections; the second and third sections served as the mid-diaphysis sites. The tibia at the diaphysis site was mostly a cortical bone, and its chemical properties were measured using Raman spectroscopy.
Measurement of bone chemical properties by Raman spectroscopy
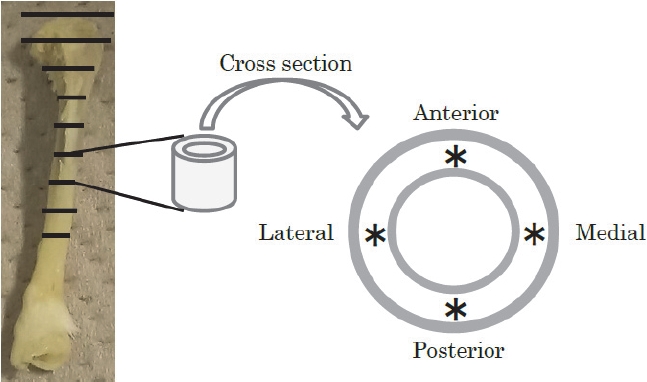
The left side of the tibia was examined. The measurement area is shown in Figure 1. From the point of polarization of the fibula to the proximal part, the mid-diaphysis tibia was divided into eight sections. An electric cutter (Mini Router, PROXXON, KISO POWER TOOL, Osaka, Japan) was used to prepare the samples. Raman microspectroscopy was also performed (ALMEGA SYSTEM E, ThermoFisher Scientific, Inc., USA) using a 35 mW excitation light source at 785 nm at an exposure time of 1.0 s (10 exposures) and a microscope at 50× magnification. To investigate the directional effects of running exercise on the molecular structure and component ratios in the transverse section of the cortical site, four regions: anterior, posterior, lateral, and medial, corresponding to body orientation, were measured, as shown in Figure 1. Two points were measured in each region, and the average of these points was used as the measurement value. Eight points were measured per sample, and the average of these points was used as the measured value of the bone sample for group comparison.
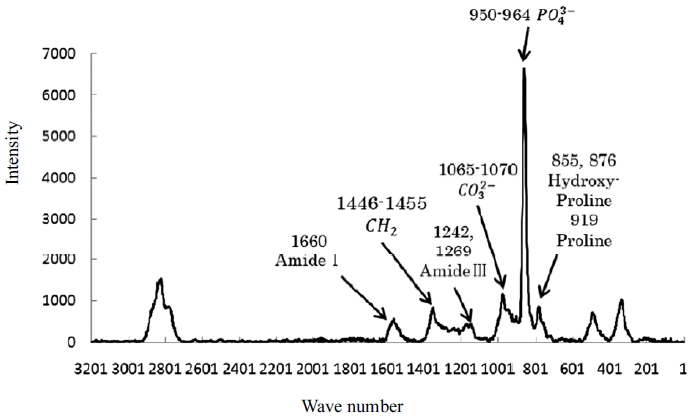
Figure 2 shows the Raman spectra of the mid-diaphysis tibia in sedentary rats and the band assignments. Phosphate (950-964 cm˗1) and carbonate ions (peaks at 1065-1070 cm˗1) were identified as mineral components of hydroxyapatite [18]. Furthermore, peaks related to amide I (1660 cm˗1) and the cross-linked structure (1690 cm˗1) were also identified [18]. The crystallinity of the mineral was calculated as the inverse of the width of the phosphate band at half-maximum intensity. The mineral-to-matrix ratio (950-964/1660), carbonate-to-phosphate ratio (1065-1070/950-1964), and collagen crosslink maturity (1660/1690) were calculated from the ratios of each peak value [14,18].
Statistical analysis
All data are expressed as the mean ± standard error (SE). A two-way analysis of variance (ANOVA) was used with exercise (sedentary or exercised) and restriction (ad libitum feeding or food restriction) as between-subject factors. Pairwise comparisons were performed using Bonferroni’s corrections if significant interactions were found in any analysis. When the interactions were not significant, only the main effects were considered. The Welch’s t-test was used to analyze the running distance and the proportion of the power spectrum of the running distance from 0.2 to 0.3 Hz in the total power spectrum. The Pearson correlation coefficient was used to analyze the relationship between the bone breaking energy of the femur and the bone chemical properties, or BMD, of the mid-diaphysis tibia. The P-value <0.05 was considered statistically significant. Statistical analyses were performed using SPSS Statistical Package (Ver. 25; IBM Inc., Chicago, IL, USA).
RESULTS
General characteristics, breaking energy of femur, and BMD of mid-diaphysis tibia
Table 1 presents the results of food intake, running distance, energy availability, final body weight, abdominal fat weight, uterus weight, spectral analysis of running distance, breaking energy of the femur, and the BMD of the mid-diaphysis tibia. Food intake, running distance, and energy availability are expressed as the mean of the experimental period. Although these results, with the exception of BMD, have been previously reported [13], this paper also briefly describes them.
First, in terms of energy availability and body weight, our findings revealed that the interaction of exercise and food restriction resulted in low energy availability and that the main effect of either exercise or restriction decreased body weight and abdominal fat. The resulting weights in the groups in descending order, from heaviest to least, are as follows: SED, EX, SED-FR, and EX-FR.
Second, in terms of reproductive function, our findings revealed that rats in the EX-FR group had an abnormal estrous cycle. A significant interaction of exercise and restriction on the uterus weight was observed. The uterus weight in the SED-FR group was significantly higher than that in the SED group, and it was significantly lower in the EX-FR group than in the EX and SED-FR groups. Furthermore, the proportion of the power spectrum of the running distance from 0.2 to 0.3 Hz in the total power spectrum was significantly lower in the EX-FR group than in the EX group.
Third, food restriction reduced bone strength and BMD under both sedentary and exercise conditions. Further, a significant interaction of exercise and restriction on breaking energy of the femur was observed. Breaking energy was significantly higher in the EX group than in the SED group, significantly lower in the SED-FR group than in the SED group, and significantly lower in the EX-FR group than in the EX and SED-FR groups. Moreover, food restriction had a significant main effect on lowering the BMD of the mid-diaphysis tibia.
Bone chemical properties
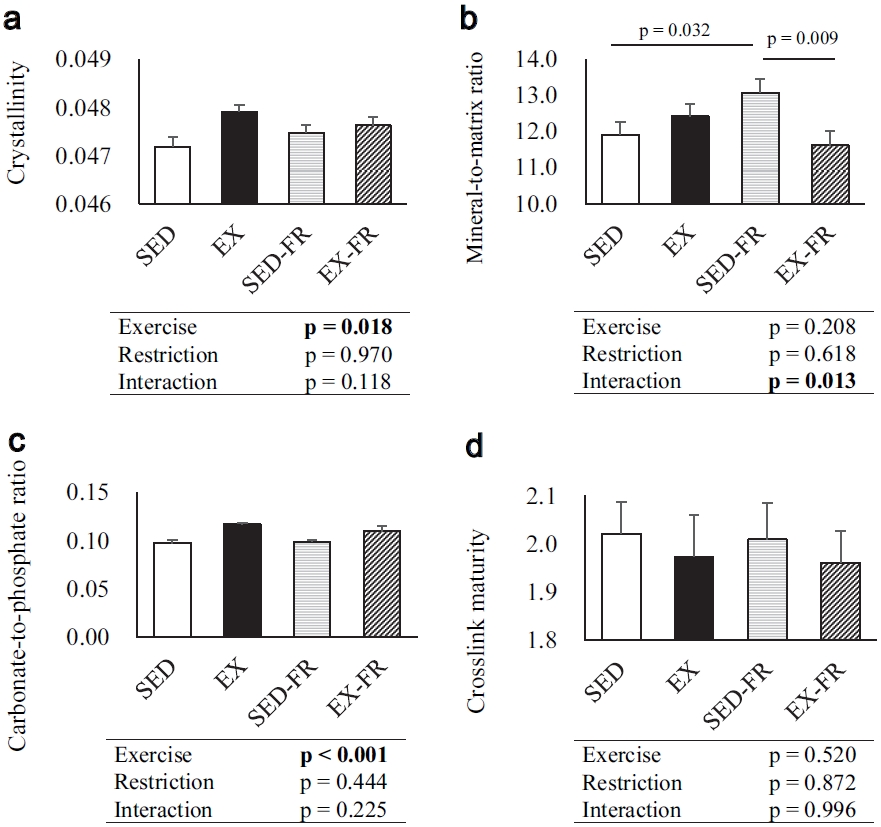
First, we described results of the total region of the mid-diaphysis tibia (Figure 3). There were significant interactions of exercise and restriction on the mineral-to-matrix ratio of the mid-diaphysis tibia, but no significant interactions on crystallinity, carbonate-to-phosphate ratio, or crosslink maturity of the mid-diaphysis tibia. The mineral-to-matrix ratio of the mid-diaphysis tibia was significantly higher in the SED-FR group than in the SED group and significantly lower in the EX-FR group than in the SEDFR group. Running exercise had significant main effects on causing higher the crystallinity and carbonate-to-phosphate ratio of the mid-diaphysis tibia. Running exercise and food restriction had no effect on the crosslink maturity of the mid-diaphysis tibia.
Second, we described the results of the mid-diaphysis tibia’s directional effects. (Table 2). There were significant interactions of exercise and restriction on the mineral-to-matrix ratio of the lateral and medial sides as well as the carbonate-to-phosphate ratio of the posterior side, but no significant interaction on other parameters. The mineral-to-matrix ratio of the lateral side of bone in the SEDFR group was significantly higher than that in the SED group, and that of the lateral and medial sides in the EXFR group was significantly lower than that in the EX-FR group. The carbonate-to-phosphate ratio in the posterior region was significantly higher in the EX group than in the SED group. Running exercise had significant main effects on causing higher the crystallinity of the anterior and the carbonate-to-phosphate ratio of the four regions but causing lower the crosslinking maturity of the medial region. Food restriction had not significant main effects on any of these parameters.
Correlation between bone breaking energy and bone chemical properties, or BMD
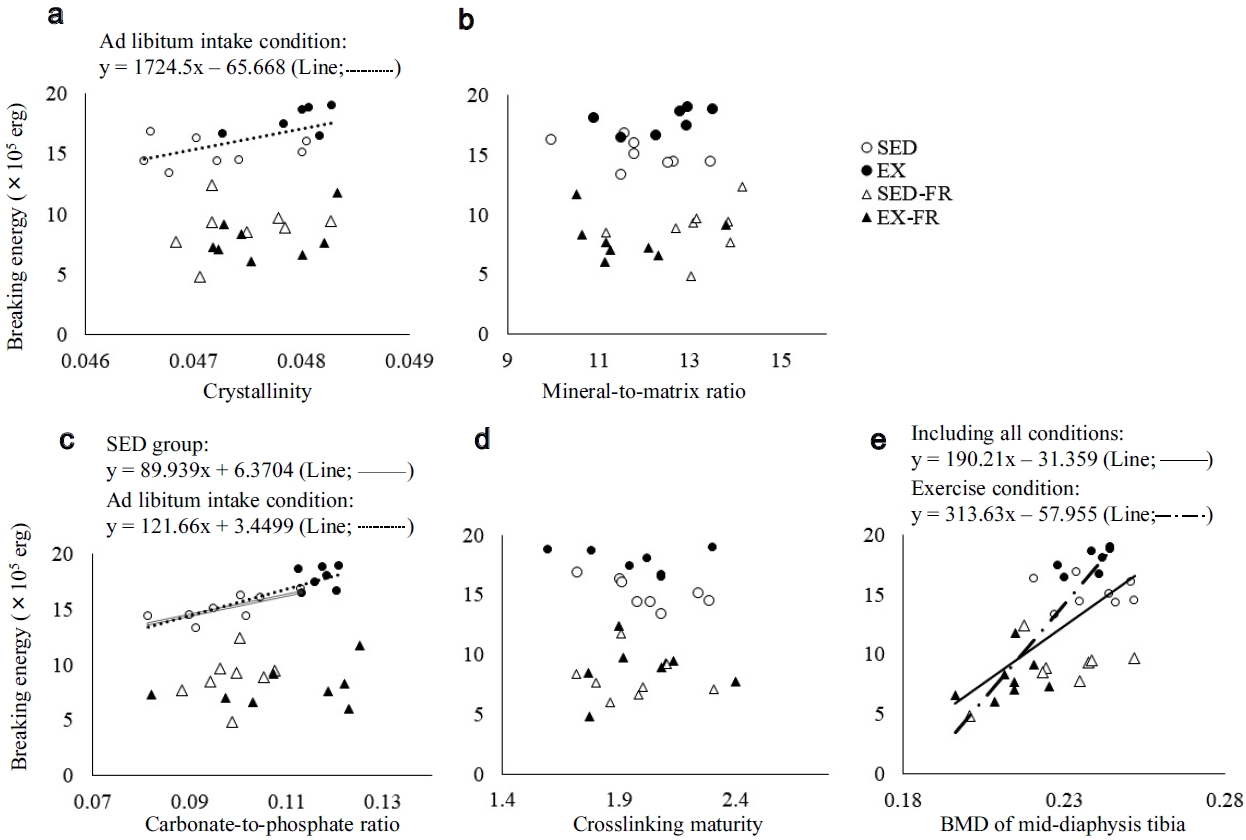
A scatter diagram of the breaking energy of the femur and the bone chemical properties, or BMD in the mid-diaphysis tibia is shown in Figure 4. In terms of chemical properties, there was a significant positive correlation between breaking energy and crystallinity in the ad libitum intake condition (r = 0.593, p = 0.025), and a significant positive correlation between breaking energy and the carbonate-to-phosphate ratio in the SED group (r = 0.746, p = 0.034) and ad libitum intake condition (r = 0.854, p < 0.001). Meanwhile, no significant correlations were found between the breaking energy and the mineral-to-matrix ratio or crosslinking maturity. Furthermore, there were significant positive correlations between breaking energy and BMD under the exercise conditions (r = 0.883, p < 0.001) and Including all conditions (r = 0.650, p < 0.001).
DISCUSSION
The purpose of this study was to investigate the effect of combination of running and food restriction on the chemical properties of bone in young female rats. Furthermore, we investigated whether the chemical property parameters correlated with the bone-breaking strength. Running exercise increased the crystallinity and carbonate-to-phosphate ratio of the mid-diaphysis tibia. The interaction of running and food restriction on the mineral-to-matrix ratio of the mid-diaphysis of the tibia was also evaluated. Furthermore, in the ad libitum intake condition, there was a significant positive correlation between breaking energy and crystallinity, or carbonate-to-phosphate ratio. The results indicate that the effects of running on bone chemical properties are not constant and vary with dietary conditions.
The effect of exercise on bone chemical properties depends on the type and intensity of exercise. A previous study reported that high-intensity treadmill running increased crystallinity and the carbonate-to-phosphate ratio of the subchondral trabecular tibia while decreasing the mineral-to-matrix ratio of the subchondral trabecular tibia in rats [19]. Another study reported that low- or high-intensity swimming slightly increased the carbonate-to-phosphate ratio in the mid-diaphysis femur [17]. However, low or moderate treadmill running does not affect the chemical properties of the subchondral trabecular tibia [19] or mid-diaphysis femur [21]. In the current study, wheel running increased the crystallinity and carbonate-to-phosphate ratio of the mid-diaphysis femur, similar to high-intensity treadmill running [19] and swimming [17] in previous studies. The distance covered by wheel running was significantly greater than that covered by treadmill running. Based on the present and previous studies, high-intensity or high-volume exercise may increase the crystallinity and carbonate-to-phosphate ratio of the bone; however, these results are not consistent with those of lowor moderate-intensity exercise. Mineral crystallinity indicates mineral maturation, and the carbonate-to-phosphate ratio indicates the extent of carbonate substitution in the mineral lattice. An increase in these parameters with exercise may affect bone strength. Notably, the present study showed that the crystallinity and carbonate-to-phosphate ratio of the mid-diaphysis tibia correlated with breaking energy under ad libitum intake conditions.
The mineral-to-matrix ratio of the mid-diaphysis tibia was increased by food restriction under sedentary conditions, but this effect was lost during running. The mineral-to-matrix ratio, which indicates the degree of mineralization, is higher in humans with osteoporosis, aged bones in humans and mice, and systemic disease model rats (diabetes mellitus and chronic kidney disease), and lower in rats with spinal cord injury and ovariectomy [23]. These findings suggest that mineral and matrix imbalances could be linked to bone fragility [23]. Therefore, food restriction may result in abnormally high mineralization. Conversely, the combination of running and food restriction did not increase the mineral-to-matrix rate, but the value was the lowest (no significant difference). The cause of this unexpected result is unclear. However, this outcome may indicate unfavorable abnormally low mineralization. In female athletes, the tibia and femur are the most common sites of stress fractures after the foot [24,25]. Stress fractures at these sites may be caused not only by low BMD, but also by abnormal lower mineralization, and the present results indicate this possibility.
The current findings revealed inconsistent directional effects of running exercise and food restriction on bone chemical properties. The degree of mechanical loading to which the tibia is subjected during exercise may vary with the direction. A one-position evaluation may miss all directional effects on the bone. Therefore, it is better to perform measurements in all directions, as was done in the current study.
Including all conditions, the BMD of the mid-diaphysis tibia and breaking energy of the femur were correlated. BMD is commonly used as a proxy measure of bone strength, accounting for 60-70% of bone strength [26]. This is supported by the current findings. Furthermore, despite being limited to ad libitum intake, the crystallinity and carbonate-to-phosphate ratio of the mid-diaphysis tibia were correlated with the breaking energy. Several previous studies have reported correlations between the chemical and mechanical properties of bone. In a rat model of chronic kidney disease, Iwasaki et al. [18] identified increasing crystallinity and decreasing crosslinking maturity as independent contributors to an increased storage modulus. According to Akkus et al. [27], increasing crystallinity, mineral-to-matrix ratio, and carbonate-to-phosphate ratio are significantly correlated with decreasing elastic deformation capacity with age in female rats. According to Yerramshetty et al. [15], increasing crystallinity increases tissue-level strength and stiffness, while decreasing ductility. Current and previous studies suggest that crystallinity improves bone properties; however, the results for other parameters are inconsistent. Further research on the relationship between the chemical and mechanical properties of bone is needed.
This study had two limitations. First, the lean mass was not analyzed. Therefore, the energy availability in the current study may not be an accurate parameter. In the future, measuring lean body mass using DXA would allow for a more accurate assessment of the status of rats as female athlete triad models. Second, only the three-point bending method was used to evaluate the bone strength. This method would reflect the strength of some traumatic fractures but is supposed to be inadequate to reflect the strength of stress fractures. Testing with cyclic loading at low power may mimic the loading at which stress fractures occur.
In conclusion, our findings showed that running exercise increased the crystallinity and carbonate-to-phosphate ratio of the mid-diaphysis tibia. The interaction of running and food restriction on the mineral-to-matrix ratio of the mid-diaphysis of the tibia was also demonstrated. Furthermore, under ad libitum intake conditions, positive correlations were found between the breaking energy and crystallinity, or carbonate-to-phosphate ratio. Based on these findings, we suggest that a more detailed assessment of the effects of exercise and/or food restriction on bone can be obtained by analyzing not only bone mineral density, which is the most common measure, but also the chemical properties of bone.