Conceptualization and development of a questionnaire to determine physical activity barriers
Article information
Abstract
[Purpose]
Considering the role of physical activity on public health and the high prevalence of physical inactivity worldwide, determining physical activity barriers is critical and will be a road map for future planning. This study aimed to develop a comprehensive questionnaire to determine physical activity barriers.
[Methods]
By reviewing previous studies, the main domains of the questionnaire were established. A physical activity expert interviewed 20 individuals aged 18 to 65 years. The results were evaluated by an expert panel for a content validity index. Face validity, test-retest reliability, and internal consistency were established on 204 individuals.
[Results]
The content validity index in all items was within the acceptable range (>0.85). Face validity was appropriate, and the misunderstanding index was < 20% in all items. Test-retest reliability in the final questionnaire in all items based on Cohen’s kappa was > 0.20, indicating fair agreement. Internal consistency with Cronbach’s alpha of 0.63 was within the acceptable range.
[Conclusion]
The study revealed that the newly designed survey is valid, accurate, and reliable. The use of this comprehensive tool by policymakers would help them properly identify the perceived barriers, and thus perform better physical activity interventions as promotional health programs.
INTRODUCTION
Physical activity(PA) is defined as any body movement produced by skeletal muscle contraction which mandates energy consumption [1]. Sufficient PA reduces the risk of premature mortality and development of numerous chronic diseases, including cerebrovascular disease, cardiovascular disease, hypertension, diabetes, obesity, and mental diseases [2]. It was estimated that in 2017, 1.2 million deaths were attributed to physical inactivity, worldwide [3]. Having adequate PA is one of the predominant indicators of public health, and noticeable health benefits are obtained by minor changes in PA level [2]. Globally, 1 in 4 adults have insufficient PA level according to the world health organization’s recommendations [4]. This causes or triggers medical conditions and non-communicable diseases related to insufficient PA in 1.4 billion individuals [4]. In Iran, the insufficient PA level has increased from 23.1% in 2001 to 55.4% in 2016, based on STEPwise Approach to NCD Risk Factor Surveillance (STEPS) surveys, and there is a need for urgent action [5].
The socio-ecological model suggests that intrapersonal, interpersonal, and environmental domains determine individuals’ PA levels [6,7]. Determining PA barriers and developing action plans to eliminate them might be an acceptable strategy to improve the level of PA [8-11]. Socioeconomic characteristics, including income, level of education, and occupation have been suggested as determinants of health behaviors [12].
Different studies have been conducted to determine the motivators and PA barriers in various populations [13,14]. In a study on Australian adults, Hoare et al. found that lack of time, preference for doing other things, and lack of enjoyment of active behavior are the main PA barriers among inactive people [13]. In another study, Baert et al. found intrapersonal factors as the most important PA barriers among older adults [14]. However, there is no comprehensive and integrative questionnaire focusing on PA barriers, and there is a need for such a questionnaire. Determining the PA barriers might be a roadmap for policymakers, stakeholders, and researchers to develop interventions and future planning to improve PA levels [8,9]. Additionally, such a questionnaire facilitates the comparison of populations and tracking changes over time, and it can be used for research purposes. Therefore, this study aimed to conceptualize and develop a questionnaire to determine PA barriers.
METHODS
The study was conducted between February 2021 and July 2021. All participants were provided with comprehensive details regarding the study’s objective and asked to sign an informed consent form. This study was conducted in accordance with the Declaration of Helsinki, and the Tehran University of Medical Sciences ethics committee approved the study protocol (ethics code: IR.TUMS. NI.REC.1399.019).
The study was performed in two stages. First, the initial version of the questionnaire was developed. Second, the reliability and validity of the questionnaire were evaluated, and it was finalized.
Development of the questionnaire
Literature review
The scope of the questionnaire’s content, including PA barriers, was established by reviewing previous studies. A clear description of PA barriers was established, existing questionnaires were assessed, and the main PA barriers based on the current literature were established. Main domains of PA barriers and existing cognitive and transtheoretical features, including socioeconomic, cultural, individual, and environmental barriers, were established.
In-depth interviews
Twenty individuals, aged between 18 to 65 years were interviewed by a PA expert, individually. PA was defined as any movement of the individual’s body produced by skeletal muscles, leading to energy consumption. PA could be engaged in various domains, including work-related, housekeeping, travel, recreational activities, and sports in daily living. A principal PA expert conducted all interviews. Participants were encouraged to discuss the PA barriers in their daily lives. The duration of each interview session was between 30 to 60 minutes. All sessions were audio-recorded and accurately transcribed. The main domains for PA barriers were applied during the sessions to guide the interview, and further details were obtained and recorded following each session. The results of the interviews were analyzed and included in the questionnaire. The principal concepts were obtained from the interviews, and personal information was omitted. All statements were indexed, and the questionnaire was reorganized according to indexes. Statements from the interviews were added with a clear, simple, and intelligible structure.
Expert panel
An expert panel was developed, consisting of seven members with at least 5 years of experience in the PA research, executive, or governance domain. The expert panel members were specialists in sports medicine, physical education, and psychology. The questionnaire’s content was assessed and screened by the expert panel in detail. The content validity index (CVI) was applied to evaluate the validity. The expert panel assessed each statement and scored the items based on the relevance of each statement to the purpose of the project (1 = not relevant, 2 = major revision is required to induce relevance, 3 = minor revision is required to induce relevance, 4 = highly relevant). CVI for each statement was established based on experts’ opinions, and statements were revised or omitted if they did not reach the minimum score required [15].
Validity and reliability
A pilot study was conducted on 204 individuals aged 18 to 65 years with the ability to engage in PA and the desire to participate in the study. We designed an online form containing the questionnaire and questions regarding the eligibility of participants. We used convenience and snowball sampling methods to recruit the individuals. Face validity was established via interviewing 20 individuals, and the misunderstanding index was established for each statement. The acceptable misunderstanding index for any statement was < 20% and if the item did not meet the cut-off, it was omitted. Test-retest reliability was assessed considering 56 individuals with a 2-week interval. Internal consistency was established by calculating Cronbach’s alpha.
Statistical analysis
If the CVIbased on the expert panel’s opinion was a minimal 0.83, it was considered acceptable [15]. For face validity, a misunderstanding index of < 20% was accepted. We calculated numbers and percentages to evaluate the frequency of answers to each item. We used Cohen’s kappa to assess the agreement between participants’ responses to each item in the first and second rounds of the study. We considered kappa ≤ 0.2 as a poor agreement, 0.2 < kappa ≤ 0.4 as a fair agreement, 0.4 < kappa ≤ 0.6 as a moderate agreement, 0.6 < kappa ≤ 0.8 as a good agreement, and 0.8 ≤ kappa as a very good agreement [16]. We excluded items if there was a poor agreement between participants’ answers in the first and second rounds of the study. Subsequently, Cronbach’s alpha was calculated to evaluate the questionnaire’s internal consistency, and we considered Cronbach’s alpha values between 0.6 to 0.8 as an acceptable internal consistency and Cronbach’s alpha of 0.8 or higher as a very good internal consistency [17]. We also performed exploratory factor analysis (EFA) to determine the construct validity. We established the extracted factors by inspecting the Scree plot, and those with an eigenvalue of higher than one, were considered as prominent factors.
Data availability
The data that support the findings of this study are available upon reasonable request.
RESULTS
In total, 204 individuals participated in the study, of which, 56 participants completed the questionnaire in the second round. Figure 1 shows the study flow diagram. Based on the CVI, four items were excluded from the questionnaire. The CVI of the remaining items were above 0.85, which were within the acceptable range. Additionally, we excluded six items due to poor agreements between participants’ answers in the first and second rounds of the study (kappa<0.2). Face validity was acceptable, and the misunderstanding index was < 20% in all the remaining items. The questionnaire’s internal consistency was calculated with the remaining items, and Cronbach’s alpha of 0.568 was established. Therefore, we excluded another item that led to an increase in the questionnaire’s internal consistency. The percentage of participants’ positive responses to the items of the final questionnaire and the agreement between participants’ answers to each item are shown in Table 1.
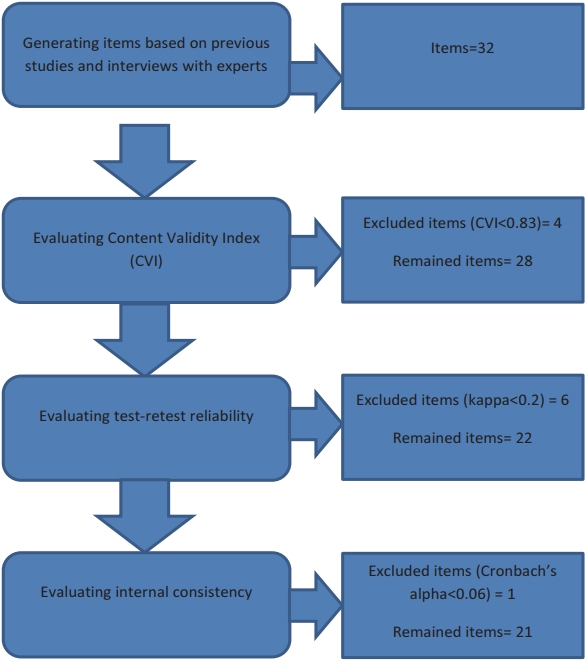
Flow diagram of the study.
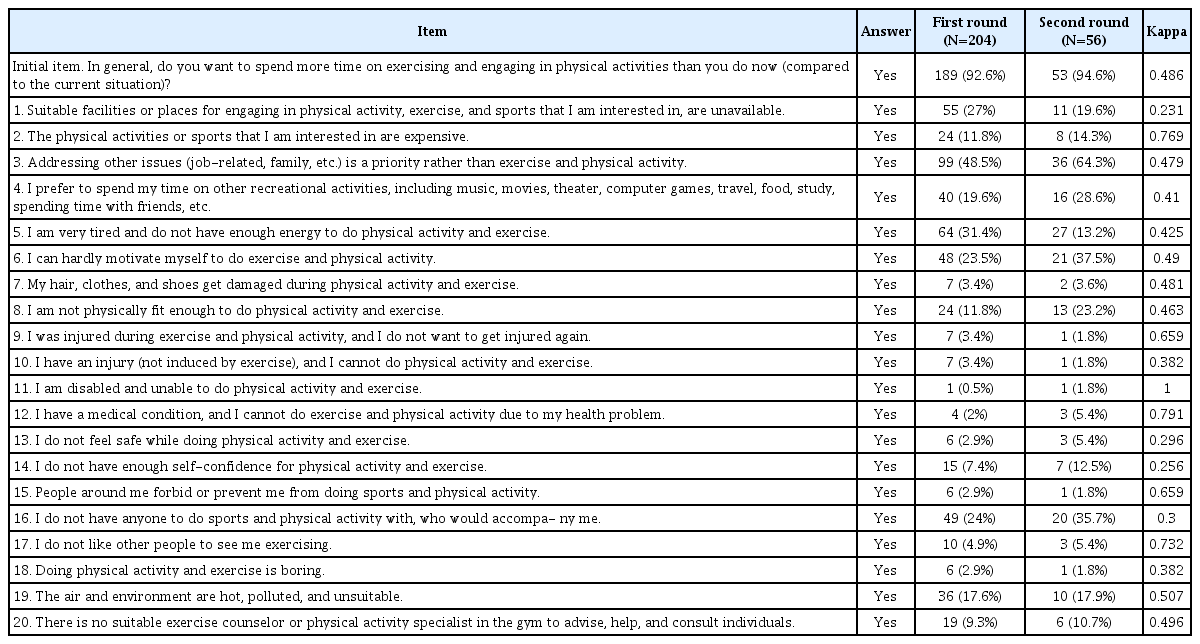
Participants’ responses to each item of the final version of the questionnaire in the first and second rounds of the study and their agreement on each item.
We performed EFA to determine the factor structure of the questionnaire. There were nine factors with an eigenvalue > 1. However, only one of these factors could explain > 10% of the variance (Figure 2). Furthermore, the Scree plot curve indicated that only one factor could be extracted.
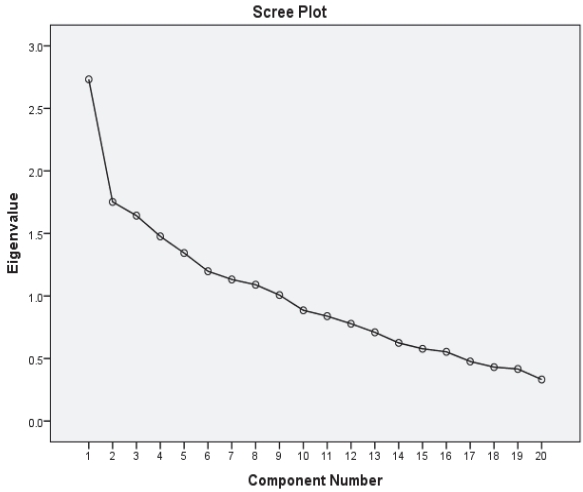
Scree plot of final 20 items.
DISCUSSION
Regular PA might be challenged due to the fact that perceived barriers may lead to significant preventive health behaviors. It seems that barrier identification could promote exercise participation [18]. In this regard, Godin et al. reported that individuals who experienced barriers to PA were more prone to be inactive than people who did not experience these barriers [19].
The aim of this study is twofold. First, in phase one, we developed a self-administered questionnaire-based tool to assess PA barriers. Second, in phase two, the reliability and validity of the questionnaire were assessed.
Our results revealed that the final 21-item questionnaire comprehensively focused on socioeconomic, cultural, personal, and environmental factors as barrier domains. The initial draft of the tool was considered a 32-item questionnaire. Although excluded items due to either low kappa or low CVI were mainly related to the personal domain, the remaining questions seemed to cover this domain adequately. Therefore, the final items were sorted into the same four axes mentioned above. This 21-item survey was found to have an acceptable internal consistency as assessed by measuring Cronbach’s alpha.
Concerning the importance of PA barriers, various questionnaires have been developed to assess these barriers among healthy and unhealthy populations [20-24].
Exercise benefits and barriers scale (EBBS) has been developed to measure the benefits of and barriers to exercise among the healthy population by Sechrist et al. [20]. In the EBBS, < 25% of items are focused on the barriers, so this valuable tool mainly measures the benefits. Although Koehn et al. indicated that EBBS is a relevant questionnaire, they proposed that increasing the number of barrier items could improve the measurement findings in the future [25]. A similar conclusion was drawn by Brown and colleagues [26]. By developing this integrated and comprehensive questionnaire focused on only PA barriers, we tried to address this issue. Barrier items in the original 43-item EBBS were limited to environment, time, physical exertion, and family discouragement factors. Koehn et al. have omitted some factors based on confirmatory factor analysis (CFA) [25]. The remaining barrier items in the modified EBBS have been categorized as time and environmental factors.
In a 2015 study, Joseph et al. categorized PA barriers among women as interpersonal, intrapersonal, or environmental determinants [27].
The main content of the current questionnaire was developed following literature review. Lack of time and motivation and safety concerns were consistently cited as PA barriers [28]. Four socioeconomic, cultural, personal, and environmental barrier domains have been addressed in this newly designed instrument. In a 2013 review by Benjamin et al., it was found that personal, social, cultural, policy, and environmental factors were the main barriers to exercise among Arabic adults [29]. Similarly, a systematic review conducted by Allen et al. revealed that PA barriers fall into categories of personal, interpersonal, environmental, and policy factors [30].
Within the domain of environmental factors, the framework suggested by Pikora et al. was considered. The proposed environmental domains comprised multiple subdomains. Accessibility to exercise facilities, structural features, and safety and aesthetic qualities were reviewed as important subdomains in this regard [31].
Using self-administered rather than interview-based questionnaires can minimize costs [32]. In this study, an adequate sample size and proper statistical analysis were used, which are believed to be the strong points of this survey. Conducting a systematic literature review for item development in the first phase is assumed to be the other key strength of the study.
The limitation of this tool is that it is developed for the healthy adult population. Thus, the generalization of its use to other populations may be unwarranted. Future studies should aim to evaluate the psychometric features of this instrument among other populations to generalize its application.
In conclusion, this study revealed that the newly designed survey is valid, accurate, and reliable. The use of this comprehensive tool by policymakers would help them properly identify the perceived barriers and thus perform better PA interventions as promotional health programs.