Associations of physical activity with gut microbiota in pre-adolescent children
Article information
Abstract
[Purpose]
To determine whether physical activity (PA), primarily the recommended 60 minutes of moderate-to-vigorous PA, is associated with gut bacterial microbiota in 10-year-old children.
[Methods]
The Block Physical Activity Screener, which provides minutes/day PA variables, was used to determine whether the child met the PA recommendations. 16S rRNA sequencing was performed on stool samples from the children to profile the composition of their gut bacterial microbiota. Differences in alpha diversity metrics (richness, Pielou’s evenness, and Faith’s phylogenetic diversity) by PA were determined using linear regression, whereas beta diversity (unweighted and weighted UniFrac) relationships were assessed using PERMANOVA. Taxon relative abundance differentials were determined using DESeq2.
[Results]
The analytic sample included 321 children with both PA and 16S rRNA sequencing data (mean age [SD] =10.2 [0.8] years; 54.2% male; 62.9% African American), where 189 (58.9%) met the PA recommendations. After adjusting for covariates, meeting the PA recommendations as well as minutes/day PA variables were not significantly associated with gut richness, evenness, or diversity (p ≥ 0.19). However, meeting the PA recommendations (weighted UniFrac R2 = 0.014, p = 0.001) was significantly associated with distinct gut bacterial composition. These compositional differences were partly characterized by increased abundance of Megamonas and Anaerovorax as well as specific Christensenellaceae_R-7_group taxa in children with higher PA.
[Conclusion]
Children who met the recommendations of PA had altered gut microbiota compositions. Whether this translates to a reduced risk of obesity or associated metabolic diseases is still unclear.
INTRODUCTION
Children can achieve substantial health benefits by engaging in moderate-to-vigorous physical activity (PA) for periods of time that add up to 60 minutes or more each day (current recommendations for ages 6–17 years) [1]. It appears that, as in adults, the total amount of PA is more important, for achieving health benefits, than any component of the activity (i.e., frequency, intensity, or duration) or a specific mix of activities (i.e., aerobic, muscle strengthening, and bone strengthening) [1]. However, based on the 2018 United States Report Card on PA for Children and Youth, only about 24% of children meet the recommended 60 minutes of PA every day [2]. PA is not only vital to the physical, psychological, social, and cognitive health of children [3,4], but it may also play an important role in shaping the human gut microbiota [5-7].
The human gut microbiota has been associated with maintaining host physiological states, including immune responses, metabolism, and mental and physical development [8]. Thus, understanding the mechanisms that maintain microbial balance in the gut is important. Changes in the composition of the gut microbiota have been associated with short- and long-term health conditions, such as overweight, obesity [9], atopy manifestations, metabolic syndromes, chronic inflammatory diseases [10,11], increased risk of allergy and asthma [12,13], and neurodevelopmental disorders [14]. Generally, a high microbial diversity is thought to be associated with a healthy gut microbiota, whereas loss of diversity appears to correlate with incidence of disease [15]. The human gut microbiome is a complex community that begins to develop at infancy [16-18]. While the gut microbiome composition is largely determined in early life [19-27], a variety of factors may perturb its composition across the life course. However, little is known about these factors in pre-adolescents [28,29].
There is a significant lack of research regarding the effects of lifestyle factors such as PA on the gut microbiome of children, as most of the studies have focused on adults [30,31].
PA has recently emerged as a probable modulator of the human gut microbiome [32-34]. Animal studies have shown that PA training independently alters the composition and functional capacity of the gut microbiota [35-38] and increases the relative abundance of butyrate-producing taxa [39]. The influence of PA on the human gut microbiota has been reported in several studies [40-42]. For example, increased levels of Faecalibacterium prausnitzii, Roseburia hominis, and Akkermansia muciniphila were observed in women who performed at least 3 hours of PA per week [40]. Moreover, longitudinal intervention studies ranging from six to eight weeks in duration suggest that exercise has independent effects on the gut microbiota [43,44]. Recently, studies exploring the role of PA on the gut microbiome of children have been published [5-7]. Previous studies have reported that exercise-induced alterations of the gut microbiota in children may depend on BMI and exercise modality and intensity and an obesity-related deleterious microbiota profile may be positively modified by exercise [6]. Specifically, the gut microbiota of children who exercise daily displays enrichment of Firmicutes and the genera Clostridiales, Lachnospiraceae, and Erysipelotrichaceae [6].
Despite the growing body of evidence showing that the gut microbiota influences health and disease in childhood, and the well-established benefits of PA on children’s health [4], more research is needed on the role of PA in the composition of the gut microbiota in children. While published studies support an association [5-7], these studies were limited due to factors such as broad age range (7-18 years) [6], lack of validated instruments to assess PA [6,7], and limited race/ethnic diversity. Thus, the primary aim of this study was to determine whether there is an association between PA and gut bacterial microbiome in a cohort of 10-year-old children from a racially and socioeconomically diverse Wayne County Health Environment Asthma and Allergy Longitudinal Study (WHEALS) birth cohort.
METHODS
Study population
Data were analyzed from WHEALS, a birth cohort study of 1,258 maternal-child pairs living in the Detroit metropolitan area. Details of the cohort have been published [45-47]. In brief, 21- to 49-year-old pregnant women who were receiving prenatal care at Henry Ford Health System’s (HFHS) obstetrics clinics were recruited between 2003 and 2007. They were interviewed at the initial recruitment, as well as during the follow-up visits at 1, 6, 12, and 24 months, and during a phone interview at 36 months postpartum. At 10 years of age, the children enrolled into WHEALS were invited for an additional follow-up clinic visit to perform various measurements of health (i.e., a general health check-up), as well as to complete a questionnaire. Children of 10 years were selected because, while approximately 1/3 of obese preschoolers become obese adults, approximately 1/2 of obese school-age children will be obese as adults [48]. Thus, by studying body size at the age of 10 years, we are studying a time point that reveals a much greater propensity for adult obesity. Written informed consent was obtained from all the participants, including children. This study was approved by the HFHS Institutional Review Board (#1881).
Stool specimen collection
The subjects who agreed to participate in the 10-year visit were each provided with a stool sample collection kit (Protocult Collection Device paper sample collector, Ability Building Center, Rochester, MN, USA; and a Sarstedt collection tube, Nümbrecht, Germany) to collect a single fecal sample for analysis. The collection kits were distributed among the participants in small insulated cooler bags containing ice packs to keep the samples cold during post-collection transit. The participants were provided with a sheet of instructions inside the cooler bag. They were instructed to freeze their ice packs for at least one day prior to sample collection. The ice packs were rated to remain frozen for 36–48 h in an insulated container. All stool samples were retrieved from the participants or delivered to the research facility within 24 h of collection. The stool samples were then stored at –80 °C. 16S rRNA sequencing was used to profile the bacterial gut microbiota present in these stool specimens.
DNA extraction
DNA from the stool samples was extracted using the modified cetyltrimethylammonium bromide (CTAB) method as previously described for bacterial profiling [49,50]. Briefly, 500 µl of modified CTAB extraction buffer was added to 25 mg of stool in a 2 ml Lysing Matrix E (LME) tube (MP Biomedicals, Irvine, CA, USA) and the mixture incubated at 65 °C for 15 min. Samples were bead-beaten (5.5 m/s, 30 s) in a Fastprep-24 (MP Biomedicals, Irvine, CA, USA) and then centrifuged (16,000 × g, 5 min). Subsequently, the top aqueous phase was transferred to a 2 ml polypropylene 96-well plate (USA Scientific, Ocala, FL, USA). Modified CTAB extraction buffer (500 µl) was added to each LME tube, bead-beaten, and centrifuged to collect a total of 1 ml of aqueous phase per sample. After adding 1 ml of phenol:chloroform:isoamyl alcohol (25:24:1) to the collected aqueous supernatant, the samples were centrifuged (3,200 × g, 20 min, 4 °C), and the resulting upper aqueous phase was transferred to a new 2 ml polypropylene 96-well plate (USA Scientific). Polyethylene glycol/NaCl (2% v/v) was added to the collected aqueous supernatant and the mixture incubated at room temperature for 2 h. The samples were then centrifuged (3,200 × g, 60 min, 4 °C), washed with ice-cold 70% ethanol, and resuspended in 30 μl of TE buffer (Invitrogen; Waltham, MA, USA).
PCR conditions and library preparation for bacterial biomarker sequencing
The V4 region of the 16S rRNA bacterial gene was amplified using primers designed by Caporaso et al. [51]. PCR was performed in 25 μl reactions using 0.025 U Takara Hot Start ExTaq (Takara Mirus Bio Inc.; San Jose, CA, USA), 1× Takara buffer with MgCl2, 0.4 pmol/μl of F515 and R806 primers, 0.56 mg/ml of bovine serum albumin (Roche Applied Science; Penzberg, Germany), 200 μM of dNTPs, and 10 ng of gDNA. The reactions were performed in triplicate with the following conditions: initial denaturation at 98 °C for 2 min, 30 cycles at 98 °C for 20 s, annealing at 50 °C for 30 s, extension at 72 °C for 45 s, and final extension at 72 °C for 10 min. Amplicons from the technical triplicates were pooled and verified using a 2% TBE agarose e-gel (Life Technologies; Carlsbad, CA, USA), cleaned up and normalized using SequalPrep Normalization Plates (Applied Biosystems), and quantified using the Qubit dsDNA HS Assay Kit (Invitrogen, Waltham, MA, USA). The samples were pooled in equal amounts (5 ng), purified using AMPure SPRI beads (Beckman Coulter; Brea, CA, USA), quantified using KAPA SYBR (KAPA Biosystems; Wilmington, MA, USA), denatured and diluted to 2 nM, and 5 pmol was loaded onto the Illumina Nextseq cartridge with 40% (v/v) of denatured 12.5 pM PhiX spike-in control.
Biomarker sequence data processing
Paired-end sequences were assembled using FLASH v1.2.7 [52], requiring a minimum base pair overlap of 25 bp, and demultiplexed by barcode using QIIME v1.9.1 [53]. Quality filtering was performed using USEARCH v8.0.1623 [54] to remove reads with > 2 expected errors. Quality reads were dereplicated at 100% sequence identity, clustered at 97% sequence identity into operational taxonomic units (OTUs), filtered of chimeric sequences by UCHIME [55], and mapped back to the resulting OTUs using UPARSE [56]. The sequence reads that failed to cluster with a reference sequence were clustered de novo. Taxonomy was assigned to the OTUs using the Greengenes v13_5 database [57]. Sequences were aligned using PyNAST58, and a phylogenetic tree was constructed using FastTree 2.1.3 [59].
PA assessment at 10 years of age
The block PA screen (BKPAS), which has been validated for use in 8- to 17-year-old children [60], was supplied to the children during their 10-year study visit. The BKPAS is an 18-item PA screener developed by NutritionQuest that uses a self-report of activity over the previous 7 days to provide information about the frequency and duration of PA.
Overall, five total exposure variables were used to quantify the level of PA. Three of these variables were directly obtained from NutritionQuest: estimated daily moderate PA (MPA) minutes, estimated daily vigorous PA (VPA) minutes, and estimated daily recreational PA (RPA) minutes. The analysis program assigns each item to a metabolic equivalent (MET) value and classifies each item as either moderate or vigorous MET activity. It combines these MET values with the screener responses to calculate the number of MET minutes per day for each screener line item. It then calculates the number of MET minutes spent in the moderate and vigorous categories. The estimated daily moderate-to-vigorous PA (MVPA) minutes was calculated by summing the number of MPA and VPA minutes. Total MVPA was then used to determine if the child met the recommendation of 60 or more minutes of daily MVPA [1]. For this study, the primary exposure was meeting the recommendations of PA guidelines, as this most closely aligns with clinical recommendations, while the minutes per day variables were considered secondary exposures.
Potential confounders
Self-reported education of mothers was collected during prenatal interviews. Household income of the parent/guardian was recorded during the 10-year visit. The season at the 10-year visit was noted. Detroit residency criteria (as a measure of urban vs. suburban residence) were assessed using the location of residence (or last known location) provided during the 10-year-old visit. Prenatal and delivery records of mothers were abstracted to determine the child’s sex and delivery type. The child’s race was maternally reported at the 24-month postpartum visit. Breastfeeding status was maternally reported at the 1-month and 6-month postpartum visits.
At the 10-year-old follow-up visit, clinical research assistants measured the height and weight of children using protocols adapted from the PhenX Toolkit [61]. Body mass index (BMI) Z-score was calculated to define the BMI category (i.e., obese/overweight vs. normal/underweight), and overweight or obesity was defined as ≥ 85th percentile according to the Centers for Disease Control and Prevention growth charts (2000) [62]. The Block Kids Food Screener [63] was also included in the 10-year visit. Briefly, the children were asked about the frequency and quantity of consumption of various foods in the previous week to determine the food group and nutrient estimates. Latent class analysis was then used to determine the dietary patterns at age 10 as processed/energy-dense foods, variety plus high intake, and healthy [45]. The Pubertal Development Scale [64] was also included in the 10-year questionnaire to quantify pubertal development. Antibiotic use within 4 weeks prior to the 10-year stool sample collection was recorded using both chart abstraction and maternal reports.
Statistical analysis
The statistical significance level was set at 0.05. Meeting the PA recommendation was associated with potential confounders using chi-square tests and ANOVA, while Kruskal-Wallis tests and Spearman correlations were used for the minutes/day variables. The rarefied OTU table was used to calculate the alpha (richness, Pielou’s evenness, and Faith’s phylogenetic diversity) and beta (unweighted and weighted UniFrac) [65] diversity metrics. PA was associated with alpha diversity metrics using linear regression models. Associations with beta diversity were assessed using PERMANOVA with 10,000 permutations, using the adonis function of the R vegan package [66]. The multivariate homogeneity of group dispersions assumption of PERMANOVA was evaluated using the betadisper function of the R vegan package [66]. See Additional File 1; Table S1 for alpha and beta diversity definitions. The unrarefied OTU table was used to examine OTU and other taxa-level differences. Taxonomic testing was performed using DESeq2 in the R packages phyloseq [67] and DESeq2 [68], with a false discovery rate (FDR) [69] adjusted p-value < 0.05 considered significant.
The set of confounders to adjust for throughout analyses was determined using the “disjunctive cause criterion” of the variables associated with the exposure or outcome, or both [70]. Among the set of hypothesized confounders, those that exhibited associations with any of the PA variables, alpha diversity, or beta diversity were retained for the adjustment. This included prenatal maternal education, household income at age 10, location of residence at age 10, season during the 10-year visit, sex of the child, race of the child, breastfeeding status at 1-month, BMI category at age 10, and dietary pattern at age 10. Child sex, race, and BMI category at age 10 were prespecified as potential effect modifiers and were tested using interaction terms.
RESULTS
A total of 383 10-year-old children studied under WHEALS provided stool samples for 16S rRNA sequencing, of which 321 (84%) also completed the BKPAS. The children who met PA recommendations spent an average of 139 minutes per day on MVPA (SD = 86, min = 61, max = 494) compared with the average of 33 minutes per day among children who did not meet the recommendations (SD=16, min=0, max=59). Children with and without BKPAS data were compared to examine potential sources of bias. This analysis revealed only one significant variable, season at the 10-year visit (p = 0.033), with children who completed the BKPAS being more likely to have the 10-year visit in the spring or summer. This likely reflects the fact that children completing the visit during the spring or summer had more time to complete all study activities.
Factors associated with PA
We first examined factors associated with PA at 10 years of age. None of the examined factors were significantly associated with meeting the recommendation of 60 MVPA minutes per day (Table 1). For the minutes/day variables, (Table 2), sex, dietary pattern at age 10, and breastfeeding status at 1-month were significantly associated with PA measures. Specifically, males had higher VPA minutes per day (p = 0.021) and children with diets characterized by processed and energy-dense foods had the least MPA (p = 0.028) and RPA (p = 0.030) minutes per day. Additionally, children who were never breastfed had the highest number of VPA minutes per day (p = 0.030).
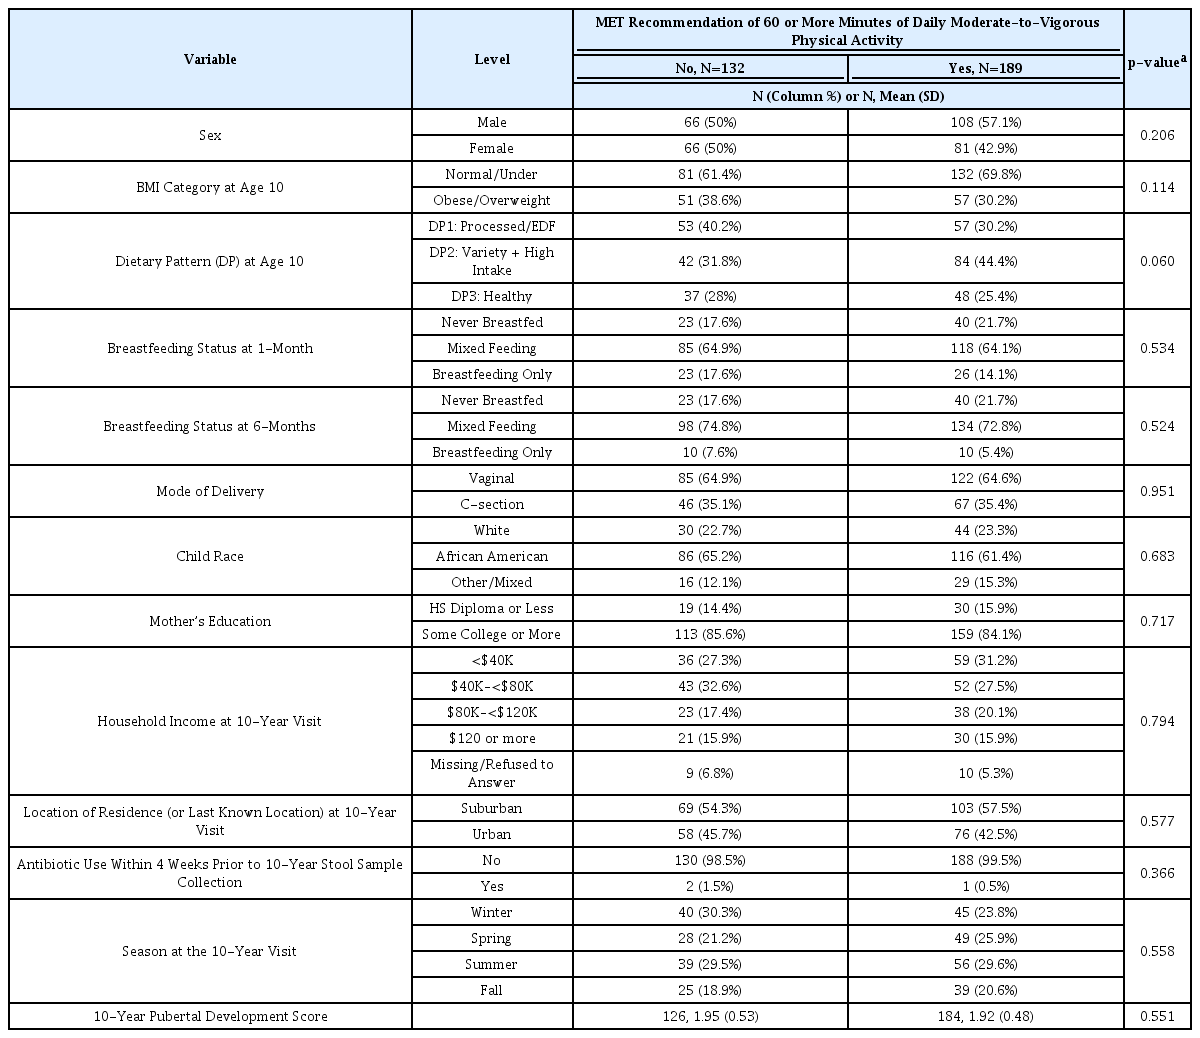
Association between maternal and child characteristics and meeting the recommendations of daily physical activity minutes.

Association between maternal and child characteristics and estimated daily physical activity minutes.
Relationships between PA and microbiota diversity
When the overall associations between PA and child gut alpha diversity metrics were assessed, no significant associations were found both before and after covariate adjustment (Table 3). However, in tests examining whether these associations differ by child sex, race, or BMI category at age 10, a total of 12 significant interactions were found, although only six of these had any within-group significance (Table 4). These six interactions modified the effects of overweight/obesity at age 10, race, and sex. Specifically, there was a significant positive association between meeting PA recommendations and bacterial evenness among the normal/underweight children, but a non-significant negative association between the same among obese/overweight children. Additionally, race modified the association between VPA minutes and richness, where increased VPA minutes were associated with lower richness among mixed/other-race children only. Furthermore, sex modified the association between MPA minutes and diversity, where only among females, increased MPA minutes were associated with increased diversity.
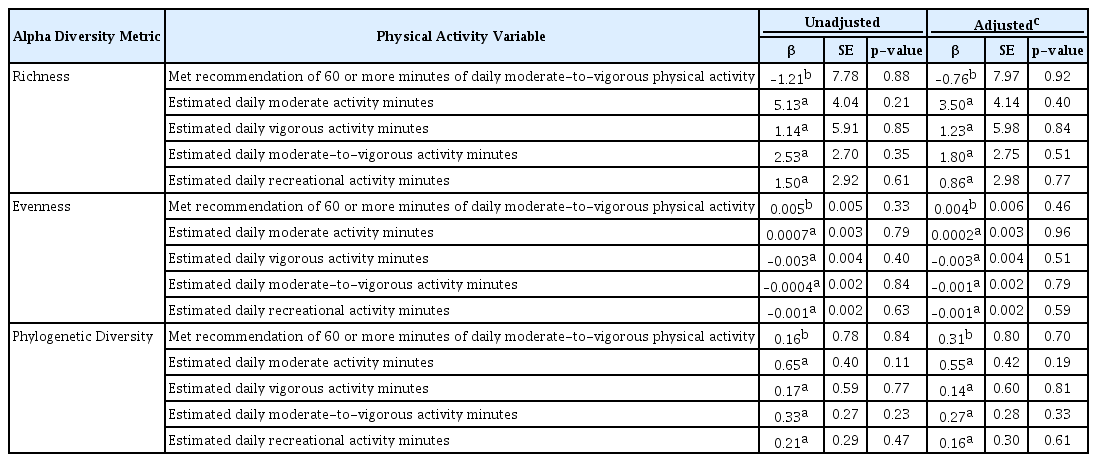
Association between physical activity and alpha diversity metrics.

Association between physical activity and alpha diversity metrics by child sex, race, and BMI category at age 10.
Relationships between PA and microbiota composition
Next, we evaluated the associations between PA and microbiota composition (beta diversity; Table 5). Those who did or did not meet the recommendation of 60 MVPA minutes per day exhibited compositionally distinct gut microbiota both before and after covariate adjustment, based on weighted UniFrac (adjusted p = 0.003), which explained 1.3% of the variation in the composition. For a sensitivity analysis, we removed the three children who had used antibiotics in the 4 weeks prior to stool sample collection, and the results were still very similar (weighted UniFrac adjusted R2 = 0.014, p = 0.002). Evaluation of the multivariate homogeneity of group dispersions assumption showed no significant difference in dispersions by group (p = 0.16), indicating that the significant PERMANOVA test result was due to true compositional distinction rather than unequal dispersions. In addition, estimated daily MPA minutes were initially associated with overall stool microbiota composition defined by unweighted UniFrac (p = 0.045, R2 = 0.005), but this was no longer significant after covariate adjustment (R2 = 0.003, p = 0.334).
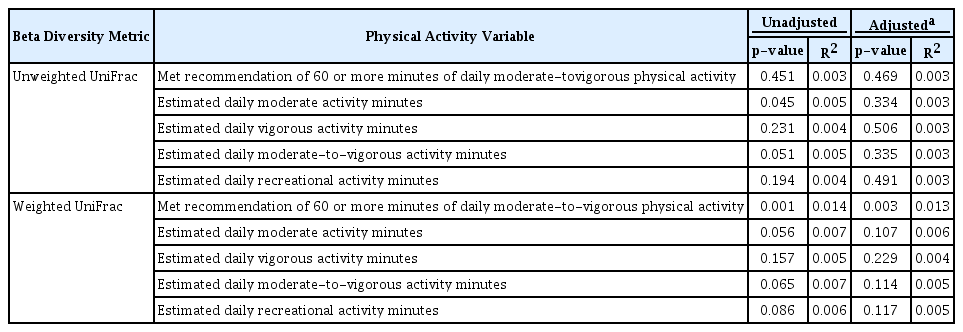
Association between physical activity and beta diversity.
Examination of the effect modifications by child sex, race, and BMI category at age 10 (Table 6) revealed three significant interactions for unweighted UniFrac/sex only. Specifically, the association between MVPA minutes as well as RPA minutes and composition was found to depend on the sex; however, none of the strata-specific p-values reached significance. Sex also modified the effect between MPA minutes and composition (unweighted UniFrac interaction p = 0.005), where an association was found among females (unweighted UniFrac R2 = 0.012, p = 0.048), but not among males (unweighted UniFrac R2 = 0.005, p = 0.623).
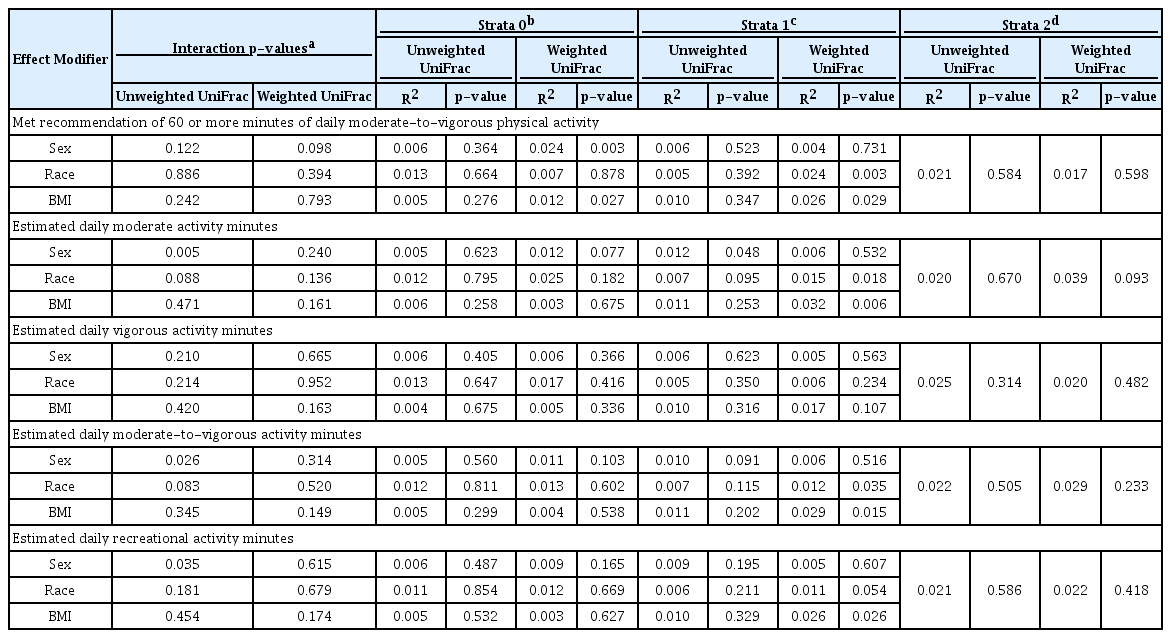
Association between physical activity and beta diversity by child sex, race, and BMI category at age 10.
Relationships between PA and gut bacterial relative abundance
We first evaluated taxonomic differences at the phylum level to determine large taxonomic shifts (Figure 1). Actinobacteria was significantly decreased in those who met the recommendations (pFDR = 0.022), while no other phyla reached statistical significance. Further analyses were then performed to determine which bacterial taxa were differentially abundant between the children who did and did not meet the PA recommendations of 60 or more daily MVPA minutes. After covariate adjustment, two genera were significantly associated with meeting the PA recommendations (see Additional File 1; Table S2). Specifically, those who met the PA recommendations had significantly increased abundance of Megamonas and Anaerovorax (both adjusted pFDR < 0.05). Additionally, 186 OTUs reached statistical significance after covariate adjustment. Six OTUs of the genera Christensenellaceae_R-7_group were significant, five of which had higher abundance in those who met the recommendations. Most of the members of the significant genus Subdoligranulum (3/4) also had higher abundance in children who met the recommendations (Figure 2). On the contrary, most of the members of the significant genera Blautia (9/12), Faecalibacterium (4/5), Roseburia (3/4), and Ruminococcaceae_UCG-014 (3/4) were less abundant in children who met the recommendations.
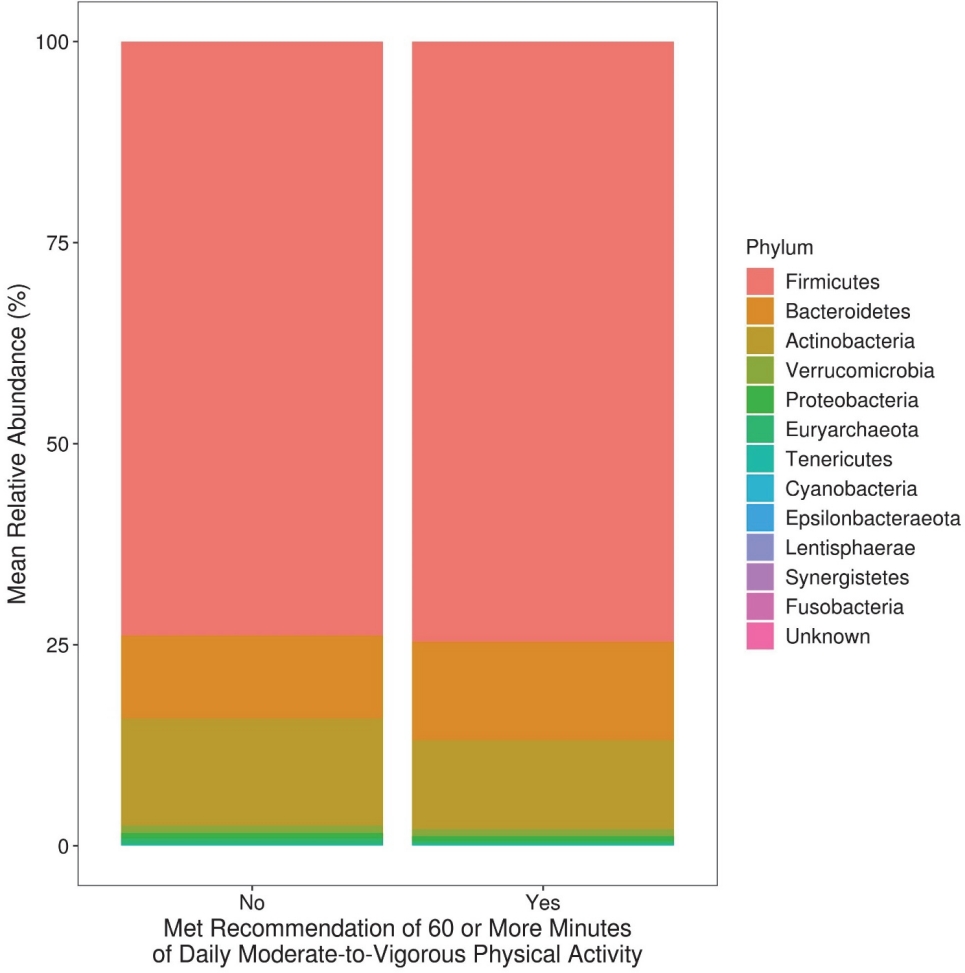
Mean relative abundance at the phylum level among 10-year-old children who did and did not meet physical activity recommendations.
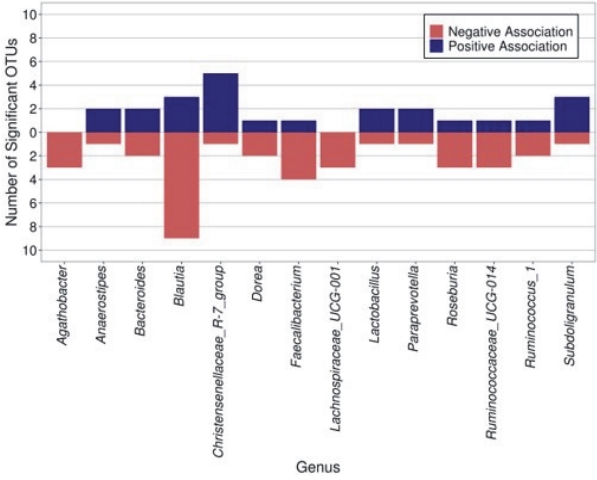
The number of significant OTUs (after covariate adjustment, FDR p < 0.05) within each genus by direction of association with meeting physical activity recommendations. Only the genera that had three or more significant OTUs are plotted.
DISCUSSION
The aim of this study was to examine whether there is an association between PA and gut bacterial microbiome in 10-year-old children from a racially and socioeconomically diverse WHEALS birth cohort. In the current study, 59% of the children reported PA levels meeting the recommendations of 60 or more minutes of daily MVPA, compared with the nationally representative data of 42.5% of 6–11 year old children from the 2018 United States Report Card on Physical Activity for Children and Youth [2]. After covariate adjustment, PA was not significantly associated with gut microbiota richness, evenness, or diversity at the age of 10. However, meeting recommendations of 60 or more minutes of daily MVPA was associated with distinct gut bacterial composition, which was partly characterized by an increased abundance of Megamonas and Anaerovorax, as well as specific Christensenellaceae_R-7_group OTUs, among others.
In this study, OTUs of the genera Christensenellaceae_R-7_group, and Subdoligranulum were enriched in children who met the PA recommendations. Christensenellaceae has been previously characterized as part of a healthy gut signature [71]. Various relationships between Christensenellaceae abundance and human health have been established, and its enrichment in individuals with normal BMI is considered the most validated association between the gut microbiome and BMI [72,73]. Moreover, Christensenellaceae has also been reported to be negatively correlated with multiple cardiometabolic risk factors including visceral fat mass, blood pressure, and metabolic syndrome [72,74]. A recent study found a higher relative abundance of Christensenellaceae_R-7_group in adolescents with obesity who completed a six-week exercise program [75]. Furthermore, Subdoligranulum has been previously identified to be associated with a healthier metabolic status [76]. Therefore, our study suggests that meeting the PA recommendations may help to create a healthy gut signature in children.
This study reports a positive association between meeting the daily recommended duration of MVPA and the abundance of Megamonas and Anaerovorax in children. This is in contrast with a study on Italian adults with obesity in which Megamonas abundance was negatively correlated with the level of PA [77]. These conflicting results may be due to differences in species or strains of this genus or the dietary inputs of these populations, emphasizing the need for additional studies of these relationships across the life course. Research connecting Anaerovorax to PA is limited, with many of the current studies being conducted in animal models [78-80]. In mice subjected to a swimming test, those with high exercise capacity had significantly lower abundance of Anaerovorax than those with low exercise capacity [78]. Anaerovorax has been shown to produce butyrate [79], which can increase insulin sensitivity and reduce adiposity, while increasing energy expenditure when supplemented in the diet of obese mice [80]. Further investigation into the relationship between Anaerovorax and PA in children is needed. Moreover, several other OTUs that we found to have altered abundance at different activity levels have also been explored in other studies. Although not as widely studied as Christensenellaceae in the context of cardiovascular health, increased exercise in adults has also been associated with a higher abundance of Faecalibacterium [40]. Conversely, we found a lower abundance of Faecalibacterium in children who met the PA recommendations. While this finding is contrary to the reported effects of exercise on Faecalibacterium in adults, further research is needed to determine whether Faecalibacterium may be more significantly influenced by lifestyle factors other than exercise. There are reports of higher levels of Faecalibacterium in the gut of US adolescents than in that of Egyptian adolescents, which could be due to the differing metabolic needs between a Western diet rich in processed foods, animal protein, and fats and a Mediterranean diet rich in plant foods [81]. Further research is needed to determine whether Faecalibacterium is more influenced by specific macro and micronutrients, as dietary patterns at age 10 were significantly associated with PA in the current study. Our results suggest that the abundance of Faecalibacterium may not be altered in children who meet PA minimums to the same extent as it might in adults who exercise at least 3 hours per week. In addition, our findings suggest lower abundance of Blautia in children who met PA recommendations, which appears to be similar to the results found in animal models [82] and adults [83]. We also found lower abundance of Roseburia in children who met PA recommendations, which is contrary to what has been found in studies focused on active adult women [40]. Moreover, previous studies on pediatric patients with obesity have reported that PA tended to increase the abundance of both Roseburia and Blautia genera [5]; however, the conditions of a controlled intervention study make it difficult to compare these results to our observational findings. Additional studies examining the complex interrelationships of PA and gut microbiota composition and health outcomes in humans are needed.
Several potential mechanisms have been proposed to explain the impact of PA on the gut microbiome. Exercise has many effects on metabolism, including decreased intestinal transit time [84]. Changes in intestinal transit time likely affects the gut microenvironment, altering intestinal pH, nutrient availability, and composition of mucus, which could alter the types and activities of the microbes that colonize the intestine [33]. Moreover, immune cells reside in close proximity to microbial communities in the tissues of the gut, and exercise might alter the gene expression of these immune cells, leading to the production of fewer pro-inflammatory and more anti-inflammatory cell-signaling proteins [85]. Differential effects on individual gut microbiome taxa require further exploration to understand how PA influences health in humans. Future studies that measure stool metabolites are required to further understand the potential mechanistic pathways.
The limitations of this study include the cross-sectional design and the collection of a single fecal sample, which is subject to day-to-day variability. Although we a priori hypothesized that PA would influence the gut microbiota composition, we cannot rule out reverse causality (i.e., gut microbiota composition influences a child’s activity level), although the results from animal studies provide support for our proposed direction of relationship. Additionally, the BKPAS evaluates PA based on the recall method with a short duration (7 days) that was only taken at a single time point. Future studies would benefit from a longitudinal measure of PA. Although the strength of our study was the use of validated self-report instruments for the assessment of PA and dietary intake, a future direction could include utilizing an objective measure of PA (e.g., activity tracking device or accelerometer). Studying a well-characterized, racially diverse cohort of pre-adolescents is also a strength, as the current microbiome literature in this age group is limited and rarely includes individuals from different races and ethnicities. Additionally, a wealth of information has been collected on these children from infancy to 10-years of age, which allowed us to adjust for a large set of confounding covariates. Future studies should consider exploring the PA and microbiome across different pediatric age groups to aid in developing a better understanding of how the composition of the human gut microbiome varies across the life course.
Although PA has recently been established as a probable modulator of the gut microbiome, alterations in the abundance of specific taxa and the extent to which specific taxa affect the body at different life stages remain unclear. Moreover, this relationship is likely confounded by several environmental factors, including specific nutrient information, necessitating further studies that can establish more definitive relationships. In summary, this study provides observational support for the importance of regular PA in shaping the gut microbiome during a period of continued growth and development, preadolescence. Specific taxa associated with health were differentially abundant among pre-adolescents who met the PA recommendations. Future studies need to assess whether this translates to a reduced risk of obesity or associated metabolic diseases.
Abbreviations
PA
Physical activity
WHEALS
Wayne County Health Environment Asthma and Allergy Longitudinal Study
HFHS
Henry Ford Health System
CTAB
cetyltrimethylammonium bromide
OTUs
operational taxonomic units
BKPAS
Block Physical Activity Screener
MPA
estimated daily moderate physical activity minutes
VPA
estimated daily vigorous physical activity minutes
RPA
estimated daily recreational physical activity minutes
MET
metabolic equivalent
MVPA
estimated daily moderate-to-vigorous physical activity minutes
BMI
body mass index
Supplementary Materials
Alpha and Beta Diversity Definitions.
Difference in genera abundance between those who did and did not meet recommendations of 60 or more minutes of daily moderate-to-vigorous physical activity.
Acknowledgements
We thank the participants of the WHEALS study.