Effects of skim milk powder intake and treadmill training exercise on renal, bone and metabolic parameters in aged obese rats
Article information
Abstract
Purpose
we aim to examine whether adding exercise has impact on obesity prevention and bone metabolism in senior rats, to which dietary obesity was induced through skim milk intake.
Methods
We used 47, 14-week old Sprague -Dawley (SD) female rats (CLEA Japan, Inc.). The Rats were separated into four random groups: 1) a Non-Ex group with a normal diet (n = 12), 2) an Ex group with a normal diet (n = 12), 3) a Non-Ex group with a skim milk diet (n = 11), and 4) an Ex group with a skim milk diet (n = 12). As the exercise for each Ex group, rats ran on a treadmill starting at 27-week old (TREADMILL CONTROL LE8710 and TREADMILL CONTROL LE8700, Harvard Bioscience). Training protocol stipulated a frequency of five times a week for 12 weeks.
Results
The leptin concentration differed with dietary content: compared to the Ex group with a skim milk diet, Non-Ex and Ex groups with a normal diet showed significantly higher values (p < 0.05). The Ex group had significantly lower values in both the normal diet and skim milk diet groups with or without exercise (p < 0.05). Compared to the Non-Ex group with a normal diet, BS/BV (mm2/mm3), BV/TV (%), Tb.Th (μm), TBPf (/mm) and Tb.N (/mm) had significantly lower in the Ex group, the Ex and Non-Ex groups with a whey protein diet, and the Ex group with a skim milk protein diet (p < 0.05).
Conclusion
These findings suggest that senior female rats fed SMP would have higher bone structural and strength parameters than rats fed a normal diet.
INTRODUCTION
In animals, similar to humans, osteogenesis ability becomes weakened with age [1]. Obesity is associated with a large number of serious complications; therefore, it can cause serious lifestyle-related diseases. The risk of increasing body fat is determined by lifestyle factors (e.g., high-energy food intake and inactivity). The accumulation of body fat impacts the health of bones [2]. The relationship between lean body mass and bone is well known [3], but the ability of bones to adapt to changes in body composition caused by changes in the diet is currently not well understood. In animals, the impact of a high-fat diet on bone health is not yet determined [4]. It is well accepted that dietary calcium intake is important for bone health [5]. The main source of calcium components is dairy. Dairy products are rich in calcium, which tends to be insufficient in our daily lives, and the absorptivity is good [6,7]. Skim milk is low in fat, yet is rich in protein, calcium, and lactose, meaning its nutritional value is high. Fried et al. [8] reported that milk protein is a combination of proteins with high-speed and low-speed absorptivity; therefore, the effects of ingesting skim milk, whey, and casein may be different.
A low level of physical activity is assumed to be a risk factor for early death along with a smoking habit, arterial hypertension, and dyslipidemia. Regular and medium-strength training is known to improve insulin sensitivity, increase HDL cholesterol level, decrease triglyceride level, and maintain a normal blood pressure, leading to weight loss [9]. In addition, regular exercise induces positive effects on bones, and is able to attenuate the bone loss induced by weight loss [10,11]. In recent years, Shah K et al. concluded that if exercise is added to the weight loss therapy provided to obese seniors, it prevents bone turnover increase and controls bone density (bone mineral density: BMD) loss in the hip induced by weight loss [12]. However, there is no study on the effect of exercise on bones using senior female rats. In addition, the mechanism of bone response during weight loss therapy and the impact of exercise are still unclear. Especially, there is little research on the combination of a skim milk diet and exercise. We examined the combined dietary effects of protein source, age, and energy density on bone microarchitecture and strength (trabecular bone structure, cortical bone structure, and cortical bone mechanical properties). We hypothesized that senior female rats fed SMP would have higher bone structural and strength parameters than rats fed a normal diet. Therefore, in this research, we aimed to examine whether exercise inclusion has an impact on obesity prevention and bone metabolism in senior rats with dietary obesity induced through skim milk intake.
METHODS
Experimental animals and rearing conditions
In this research, we used 47 14-week old Sprague -Dawley (SD) female rats (CLEA Japan, Inc.). Rats were individually raised in breeding rooms at a room temperature of 25 °C and humidity of 30%, with a dark period lasting from 8 P.M. to 8 A.M. All rats were fed the control diet (MF: CLEA Japan, Inc.) and tap water, which were made available at all times so rats could eat and drink freely. After the preliminary breeding period, rats were separated into four random groups: 1) a Non-Ex group with a control diet (n = 12), 2) an Ex group with a control diet (n = 12), 3) a Non-Ex group with a 17% skimmed milk powder diet (n = 11), and 4) an Ex group with a 17% skimmed milk powder diet (n = 12). The composition of the experimental diets is shown in Table 1. The skimmed milk powder and powdered fermented milk extract were produced by Meiji Co., Ltd. (Kanagawa, Japan).

Composition of the experimental diets (g)
Exercise conditions
The rats in each Ex group ran on a treadmill starting at 27 weeks of age (TREADMILL CONTROL LE8710 and TREADMILL CONTROL LE8700, Harvard Bioscience). The training protocol stipulated an exercise frequency of five times a week for 12 weeks. The running speed was 6 m/min for 15 minutes on the first day and was gradually increased to 10 m/min for 50 minutes by the tenth day. This experiment was conducted with the approval of the Matsumoto University Animal Experiment Ethics Committee.
Extraction and storage of tissues
Starting at 8 A.M. on the 39th week of breeding, tissue samples were extracted under anesthesia by administering 5 mg of Nembutal per 100 g of weight. The day before dissection, feeding and exercise were performed as usual, maintaining a normal rearing condition. Blood was sampled from an artery and centrifuged (bench-top multi-rack centrifuge LC-120, TOMY Kogyo Co., Ltd.). Plasma was stored in a −80 °C freezer until analysis. Liver, visceral fat, skeletal muscle (soleus muscle, extensor digitorum longus, and gastrocnemius), femur, and tibia were extracted and measured with an electronic balance. Samples of the liver and skeletal muscle were frozen immediately after extraction by soaking in liquid nitrogen and were stored in a −80 °C freezer until analysis. After removing soft tissues attached to the femur and tibia, the bones were stored in a 70% ethanol solution.
Analytical method
Biochemical examination of blood
Plasma glucose concentration
To measure the concentration of plasma glucose at the time of dissection, we used a Glucose Colorimetric Assay Kit (Cayman Chemical) and measured the absorbance with a spectrophotometer (InfiniteF200, TECAN Japan).
Plasma insulin concentration
We used a Rat Insulin ELISA Kit (Mercodia) and spectrophotometer (InfiniteF200, TECAN Japan) to measure plasma insulin concentration.
Plasma total cholesterol concentration
Plasma total cholesterol concentration was measured with a spectrophotometer (InfiniteF200, TECAN Japan) using lab assay cholesterol (Wako Pure Chemical Industries, Ltd.).
Plasma triglyceride concentration
Plasma triglyceride concentration was measured with a spectrophotometer (InfiniteF200, TECAN Japan) using lab assay triglyceride (Wako Pure Chemical Industries, Ltd.).
Plasma free fatty acids concentration
Plasma free fatty acids concentration was measured with a spectrophotometer (InfiniteF200, TECAN Japan) using lab assay NEFA (Wako Pure Chemical Industries, Ltd.).
Plasma HLD cholesterol concentration
Plasma HDL cholesterol concentration was measured with a spectrophotometer (InfiniteF200, TECAN Japan) using the EnzyChrom AF HDL and LDL/VLDL Assay Kit (E2 HL-100) (BioAssay Systems).
Plasma leptin concentration
Plasma leptin concentration was measured with a spectrophotometer (InfiniteF200, TECAN Japan) using Quantikine ELISA Mouse/Rat Leptin (R&D Systems).
Plasma adiponectin concentration
Plasma adiponectin concentration was measured with a spectrophotometer (InfiniteF200, TECAN Japan) using an Adiponectin (rat) ELISA Kit (Adipogen).
Plasma osteocalcin (Gla type) concentration
Plasma osteocalcin concentration was measured with a spectrophotometer (InfiniteF200, TECAN Japan) using a RAT OSTEOCALCIN EIA KIT (Biomedical Technologies).
Bone tissue morphometry
Measurement of bone mineral density and bone strength
BMD in the right femur and tibia were measured with dual-energy X-ray absorptiometry (DPX-L, LUNAR.USA). Structural strength of the femur was evaluated by measuring fracture energy and stiffness with a three-point bending test and a measuring device (Autograph AGS-100D, Shimadzu, Japan). Support span was set at 12mm for femoral fracture, and compression was placed at the center point in femoral length. And load weight and loading speed was 50kg and 5mm/min, respectively.
Micro CT
Images of the left tibia were taken using scanXmate-A080 (Comscan Co. Ltd., Kanagawa Prefecture), and a three-dimensional analytic device was used to find the index values for the bone structure of the tibia cancellous bone. In the images, the longitudinal axis of the tibia was aligned with the axis of revolution, and the focus was set on a point 8 grid-cells away from the epiphyseal line. A total of 480 continuous cross-sectional images were taken under the following conditions. Tube voltage = 37.5kV; tube current = 250μA; matrix diameter = 12 × 480; Projection = 600 frames; number of scans = 4. The parameters for the analysis were as follows. Bone volume/Tissue volume (BV/TV), Trabecular thickness (Tb.Th), Trabecular number (Tb.N), Trabecular separation (Tb.Sp), and Trabecular Bone Pattern factor (TBPf).
Statistical Processing
All data were presented as mean values ± standard deviation. 2-way ANOVA analysis of variance was conducted, and Tukey’s HSD method was used to determine statistical significance between groups.
RESULTS
Body composition/amount of intake
Body weight
The Ex group with a normal diet had a significantly lower body weight at the end of the experiment (p < 0.05) compared to the Ex group with a skim milk diet. With the presence/absence of exercise, only the Ex group with a normal diet showed a significantly lower value (p < 0.05).
The amount of feed and energy intake per day
Feed and energy intake amounts per day are shown in Table 2. The normal diet group had significantly lower values for daily feed intake compared to the skim milk diet group (p < 0.05). But there was no noticeable impact from the presence/absence of exercise. Daily energy intake did not show significant difference in any of the groups.

Body mass and composition
Weight of liver, fat, soleus muscle, and extensor digitorum longus at the time of dissection
The weights of the liver, fat, soleus muscle, and extensor digitorum longus at the time of dissection are shown in Table 2. There was no significant difference in the weight of the liver and soleus muscle between any of the groups. In contrast, the weight of the extensor digitorum longus at the time of dissection differed with dietary intake: compared to the Non-Ex and Ex groups with a skim milk diet, the Non-Ex group with a normal diet showed significantly lower values (p < 0.05). The Ex group had significantly higher values in both dietary groups with and without exercise (p < 0.05). There was a significant difference in the weight of fat according to the dietary content: compared to the Non-Ex group with a skim milk diet, the Non-Ex and Ex groups with a normal diet had significantly lower values (p < 0.05). In addition, compared to the Ex group with a skim milk diet, the Ex group with a normal diet showed significantly lower values (p < 0.05). The Ex group had significantly lower values only in groups with a normal diet (p < 0.05).
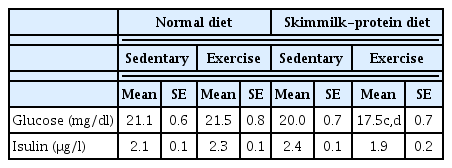
Glucose, insulin, and leptin concentrations at the time of dissection
Glucose, insulin, and leptin concentrations at the time of dissection are shown in Table 3. There was no significant difference in the glucose and insulin concentrations at the time of dissection between any of the groups. In contrast, the leptin concentration at the time of dissection differed with dietary content: compared to the Ex group with a skim milk diet, Non-Ex and Ex groups with a normal diet showed significantly higher values (p < 0.05). The Ex group had significantly lower values in both the normal diet and skim milk diet groups with or without exercise (p < 0.05).
Biochemical markers of blycometabolism profile
Plasma total cholesterol, triglyceride, free fatty acid, HDL cholesterol, and adiponectin concentration at the time of dissection
Plasma total cholesterol, triglyceride, free fatty acid, HDL cholesterol, and adiponectin concentrations at the time of dissection are shown in Table 4. Plasma free fatty acid, HDL cholesterol, and adiponectin concentrations at the time of dissection did not show significant differences between any of the groups. In contrast, there was no impact from the feed on the plasma total cholesterol concentration at the time of dissection and only the Ex group with a normal diet showed significantly lower values (p < 0.05). There was no impact from exercise on the plasma triglyceride concentration at the time of dissection, but the Ex group with the normal diet showed significantly lower values compared to the Non-Ex group with the skim milk diet (p < 0.05).

Biochemical markers of lipid profile
Bone weight of femur and tibia per body weight, plasma osteocalcin (Gla type), bone density (BMD), and bone strength
The bone weight of the femur and tibia per body weight, bone density (BMD), bone strength, and plasma osteocalcin (Gla type) are shown in Table 5. The bone strength of the femur and tibia and the plasma osteocalcin (Gla type) did not show significant differences between any of the groups. In contrast, the bone weight per body weight and the bone density (BMD) of the femur and tibia did not show significant differences with different dietary content. The Ex group for both dietary groups had significantly high values (p < 0.05): the presence/absence of exercise resulted in a significant difference.

Bone weight, BMD and Breaking strength of femur and tibia. And biochemical markers of bone matabolism
Tibia proximal cancellous bone parameters with micro-CT
Measurement results for the tibia proximal cancellous bone structure are shown in Table 6. Compared to the Non-Ex group with a normal diet, BS/BV (mm2/mm3) was significantly lower in the Ex group, the Ex and Non-Ex groups with a whey protein diet, and the Ex group with a skim milk protein diet (p < 0.05). Tb.Sp (μm) showed significantly lower values only in the Ex group with a skim milk protein diet compared to the Non-Ex group with a normal diet (p < 0.05). BV/TV (%) and Tb.N (/mm) had significantly higher values only in the Ex group with a skim milk protein diet compared to the Non-Ex group with a normal diet (p < 0.05). Compared to the Non-Ex group with a normal diet, Tb.Th (μm) showed significantly lower values in the Ex group with a normal diet, the Non-Ex group with a whey protein diet, and the Ex group with a skim milk protein diet (p < 0.05). TBPf (/mm) was significantly higher in the Ex and Non-Ex groups with a whey and skim milk protein diet compared to the Non-Ex group with a normal diet (p < 0.05).

Trabecular parameters of tibia by Micro-CT
DISCUSSIONS
There are very few studies on the effectiveness of a skim milk diet and exercise on the bones of middle-aged or old rats. Weight loss is linked to accelerated bone loss. Furthermore, exercise is known to have beneficial effects on bone. Beyer et al. (1985) reported that running training increased the femoral and tibial weights in 26-month-old male rats 12). In 19-month-old rats, training increased the skeletal calcium content 13). Thus, physical activity and fitness are important determinants of bone density in normal populations 14). In humans, increasing physical activity from a normal status of mobility produces little new bone, whereas a lot of bone is produced when the basal condition is immobility 15). We investigated the impact of a skim milk diet (SMP) and exercise on bone tissue in obese rats. The experiment results showed that body weight and fat weight at the end of the experiment were significantly lower in the normal diet group compared to the SMP groups due to the high fat intake (p < 0.05). The inclusion of exercise resulted in significantly lower values in only Ex groups with a normal diet (p < 0.05). Significantly lower values were noted in the Non-Ex and Ex groups with a normal diet compared to the Non-Ex group with SMP (p < 0.05). In addition, compared to the Ex group with SMP, the Ex group with a normal diet showed significantly lower values (p < 0.05). In the exercise groups, only the Ex group with a normal diet had significantly lower values (p < 0.05). Glucose and insulin concentrations at the time of dissection are shown in Table 3. There was no significant difference between any of the groups for glucose and insulin concentrations at the time of dissection. The Ex groups with both normal and SMP diets had significantly lower values (p < 0.05). Plasma total cholesterol, triglyceride, free fatty acid, HDL cholesterol, adiponectin and leptin concentrations at the time of dissection are shown in Table 4. Plasma free fatty acid, HDL cholesterol, and adiponectin concentrations at the time of dissection did not show significant differences between any of the groups. In contrast, plasma total cholesterol concentration at the time of dissection showed no impact from the diet, though the Ex group with a normal diet had significantly lower values (p < 0.05). In addition, plasma triglyceride concentration at the time of dissection showed no impact from exercise. However, the impact of the diet was reflected in the significantly lower values in the Ex group with a normal diet compared to the Non-Ex group with SMP (p < 0.05). Leptin concentration showed significantly higher values in the Non-Ex and Ex groups with a normal diet compared to the Ex group with SMP (p < 0.05). The bone weight of the femur and tibia per body weight, the bone density (BMD), bone strength, and plasma osteocalcin (Gla type) are shown in Table 5. The bone strength of the femur and tibia as well as the plasma osteocalcin (Gla type) did not show significant differences between the groups. Though the bone weight of the femur and tibia per body weight and the bone density (BMD) did not show significant differences due to dietary content, the Ex group in both dietary groups had significantly higher values (p < 0.05). The measurement results for the tibia proximal cancellous bone structure are shown in Table 6. Compared to the Non-Ex group with a normal diet, BS/BV (mm2/mm3) was significantly lower in the Ex group with a normal diet and in the Ex group with SMP (p < 0.05). Tb.Sp (μm) showed significantly lower values only in the Ex group with SMP compared to the Non-Ex group with a normal diet (p < 0.05). BV/TV (%) and Tb.N (/mm) showed significantly higher values only in the Ex group with SMP compared to the Non-Ex group with a normal diet (p < 0.05). Tb.Th (μm) had significantly lower values in the Ex group with a normal diet and the Ex group with SMP compared to the Non-Ex group with a normal diet (p < 0.05). TBPf (/mm) had significantly higher values in the Ex and SMP groups compared to the Non-Ex group with a normal diet (p < 0.05). Exercise did not change the osteocalcin concentration, preventing bone absorption and improving bone density in the tibia. In this research, both SMP intake and exercise induced weight loss regardless of the bone structure of obese rats without impacting bone weight and density. Exercise improved the bone density of obese rats without affecting the tibia and cortical bones. Therefore, both SMP intake and exercise adjust the energy of skeletal muscle to the minimum but do not change energy metabolism. Physical activity leads to gradual weight loss [16]. Physical activity along with dietary therapy decreases the body fat, weight, and abdominal circumference in obese individuals as verified by the rats in this experiment. Obesity treatment also corrects hormone balance [17,18]. In this research, decrease in the concentration of adipokines, which induces remodeling of bones, likely impacted the bone cells. Both SMP intake and exercise likely reduced the leptin level as a result of reduced fat. Various research papers have reported that when obese rats exercise, the leptin level decreases [19–23]. This is because leptin is made by fat cells at a rate proportional to the amount of fat stored [24]. Leptin differentiates bone marrow stromal cells into osteoblasts, suppressing their differentiation into fat cells. Therefore, the results indicate that leptin promotes bone formation. These conflicting results have not yet been explained. In this research, SMP intake and exercise likely had mutual effects that lowered leptin concentration. However, the age of the rats in this experiment at the time of dissection was 39 weeks, which was middle aged to elderly. Therefore, to take into consideration the decline due to age, younger rats should be used to conduct a comparative study. There was also a difference in the intake between the group that ingested normal food and the group that ingested a high-fat high-carbohydrate diet. This may be a result of the intake amount rather than the dietary composition. Therefore, using the pair-feeding method, an investigation should be performed using groups that consume identical amounts of food.