Effects of aging-induced obesity on the transcriptional expression of adipogenesis and thermogenic activity in the gonadal white adipose, brown adipose, and skeletal muscle tissues
Article information
Abstract
[Purpose]
Aging is closely associated with chronic metabolic diseases, such as obesity, which lead to increased adiposity, skeletal muscle wasting, and imbalanced cellular energy metabolism. However, transcriptional profiles representing energy imbalances in aging-induced obesity are not fully understood. Thus, this study aimed to investigate the candidate genes predominantly regulated in aging-related obesity in spontaneously aged mice.
[Methods]
Male C57BL/6J mice were divided into three age groups according to age: 2- (young), 12- (middle-aged), and 24- (old) months. Body weight and body composition parameters were measured in all mice. Gonadal white adipose tissue (gWAT), brown adipose tissue (BAT), and skeletal muscle (SM) were dissected and weighed. The target tissues were assessed using biochemical and histological assays.
[Results]
Aging-induced obesity increased adipose mass and decreased SM weight through processes of adipocyte hypertrophy; however, recruitment of modulating adipogenesis-inducing transcription factors did not occur. Among adipokines, leptin level was greatly increased in the gWAT during aging. Interestingly, the β2-adrenergic receptor had a higher affinity than the β3-adrenergic receptor in aging-induced obesity. For the thermogenic regulation through β-adrenergic receptors (β-ARs), a declined uncoupling protein-1 (UCP-1) in the BAT was relevant to aging-induced obesity.
[Conclusion]
Aging-induced obesity increases leptin levels in adipocytes and decreases UCP-1 in BAT through β-ARs, according to transcriptional gene profiling. WAT browning increases energy expenditure due to exercise training adaptations. Further research is needed to discover more effective methods, such as exercise, against aging-induced obesity.
INTRODUCTION
Aging is a ubiquitous phenomenon that is affected by genetic, environmental, and epigenetic events and can be defined as age-related declines in physiological processes required for survival and reproduction [1]. Aging leads to changes in body composition, including increases in fat mass. Age-related metabolic functions occur in the adipose tissue, the largest tissue in obese individuals [2]. Moreover, the remodeling of subcutaneous fat to visceral depots is suggested to be a key factor, involved in accelerating the aging process and the onset of age-related diseases [3]. The probability of age-related chronic diseases, such as cardiovascular diseases, cancer, type 2 diabetes mellitus, and neurodegenerative diseases, increases dramatically when obesity is added to aging [4]. Thus, many researchers aimed to identify novel biomarkers to investigate aging-related obesity. Therefore, immune cell activation with low-grade inflammation is important for adipose tissue function in aging-related obesity [5]. A previous study has also shown an altered number and function of infiltrating immune cells in adipose tissues [6]. Adipokines, cell-signaling molecules (cytokines) secreted by expanded adipose tissues, are closely involved in aging-related obesity. In particular, leptin released mainly by the subcutaneous white adipose tissue (sWAT) is a crucial mediator. Under normal physiological conditions, leptin controls food intake, energy expenditure, fat distribution, insulin sensitivity, free fatty acid (FFA) oxidation, and lipolysis in the periphery. Congenital leptin deficit in humans has been linked to similar phenotypic abnormalities [7], and the most notable benefit is mediated by leptin’s suppressive effects on food intake, which have been found to be a successful treatment for obesity [8]. Indeed, Brown adipose tissue (BAT) thermogenesis has been shown to be triggered by leptin, boosting UCP-1 (uncoupling protein-1) [9].
Decreased metabolic rate is a well-known factor associated with aging and obesity. Decreased energy expenditure (heat generation) during aging contributes to age-related obesity [10]. Aging slows down the physiological functions that regulate energy expenditure. Aging induces the loss of “browning” in WAT, which is the major energy-providing source of the body. BAT maintains energy balance by burning off excess calories and generating heat in the body [11]. A previous study showed a steep decline in the sub-population of energy-dissipating WAT, “BRITE (brown-in-white)”or “beige” cells in aged mice [12]. Another study reported that the expression of thermogenesis-related genes, such as peroxisome proliferator-activated receptor gamma coactivator 1-alpha (PGC-1α), cytochrome c oxidase subunit 7A1 (Cox7a1), cytochrome c oxidase subunit 8b (Cox8b), uncoupling protein-1 (UCP-1), and cell death-inducing DFFA-like effector A (CIDE-A), is aberrantly regulated in adipose and SM tissues during aging and their dysregulation is associated with age-related obesity [13]. Additionally, adipogenesis-inducing core transcription factors greatly contribute to increased adipogenesis and adipocyte size [14]. Several genetic factors regulating the progression of age-related obesity have been identified.
Accumulating evidence suggests that central sympathetic activity is important in the complications of age-related obesity [15]. Catecholamine, neurotransmitters, such as dopamine, adrenaline, and noradrenaline, which are released from the sympathetic nervous system (SNS), help control adipose tissue metabolism and thermogenesis through three subtypes of the β-adrenergic receptor (β-AR): β1, β2, and β3 [16]. Catecholamine-induced lipolysis generates energy via triglyceride hydrolysis. This process has been shown to decline with age [17]. Monoamine oxidase (MAO), an enzyme that degrades endogenous catecholamines, has also been reported to be involved in controlling obesity by regulating the adrenergic tone. MAO inhibition resulted in restricted weight gain in obese mice [18]. An increase in the gonadal WAT (gWAT) and a decrease in BAT are closely associated with aging. However, there is insufficient evidence on thermogenesis and adrenergic tone-related gene expression in gWAT, BAT, and even skeletal muscle (SM) tissues in response to age-related obesity. Therefore, this study investigated which candidate gene expressions are predominantly regulated in aging-induced obesity that modulate adipogenesis and thermogenic metabolism with tissue-specific responses in spontaneously aged mice.
METHODS
Animals and extraction of target tissues
Male C57BL/6J mice (N=24; 2-month-old [n=8], 12-month-old [n=8], and 24-month-old [n=8]) were purchased from the Korea Basic Science Institute (Gwangju, Korea) and had free access to water and normal chow before sacrifice. Three groups of mice, young (2-month-old; 2 M), middle-aged adult (12-month-old; 12 M), and old (24-month-old; 24 M), were anesthetized by administering a combination of Zoletil (30 mg/kg) and xylazine (10 mg/kg). The gWAT, BAT, and SMs (gastrocnemius and quadriceps) were dissected and weighed. The tissue samples were instantly frozen in liquid nitrogen and stored at -80℃ until biochemical analysis. The adipose tissues were stored in a 10% formalin solution for histological assays. All animal protocols were approved by the Committee on Animals of Kyung Hee University Hospital at GANGDONG (KHNMC AP 2016-009).
Body composition analysis
To quantify the body composition indexes (fat mass, lean mass, and free body fluid) of the mice, we used a body composition analyzer (#LF50, Minispec Body Composition Analysis, Bruker, Germany). Fully aware mice were immobilized in a plastic tube and placed in the instrument’s sample chamber for approximately 90 s to obtain nuclear magnetic resonance scans, as described previously mentioned [19].
RNA extraction and qRT-PCR
Total RNA was extracted from the harvested tissues using TRIzol™ Reagent (# Cat No.15596026, ThermoFisher Scientific Korea, Seoul, South Korea). According to the manufacturer’s instructions, cDNA was synthesized using a commercial cDNA synthesis kit (# Cat No. 18091050, SuperScript ™ IV First-Strand Synthesis System, ThermoFisher Scientific Korea, Seoul, South Korea). qRT-PCR was performed using the StepOne™ Real-Time PCR System (#Cat No. 4376357, Applied Biosystem™, CA, USA) to detect and amplify cDNA with the primer sequences shown in Table 1. The relative mRNA expression of the experimental target genes was calculated using the ΔΔCt method and was normalized to 18S rRNA as an internal control. Five samples from each tissue per group were used for analysis.

Primers used in this study.
Immunohistochemistry (IHC)
The gWAT and BAT were dissected, fixed with 10% buffered formalin, embedded in paraffin, and cross-sectioned at 4 μm thickness for hematoxylin and eosin (H&E) staining. IHC staining was performed in an automated system using MAO-B (ab88510; Abcam, Cambridge, UK), and gamma-aminobutyric acid (GABA; AB5016; Merck Millipore Corp. CA, USA) antibodies. Antigens were retrieved using the epitope retrieval solution 1 (NC0235529; FisherScientific, USA). The slides were incubated with antibodies at room temperature for 20 min, and then with a biotinylated secondary antibody for 8 min. The resulting complexes were detected using an avidin-peroxidase conjugate polymer, were localized with 3,3’-diaminobenzidine (DAB), and were enhanced with DAB enhancing solution (DES500, ScyTek, UT, USA). Mayer’s hematoxylin was used as a counterstain. The positive and negative control stains were used in this study. Nuclei and membrane staining were determined as positive. The H&E-stained slides were imaged under a bright-light microscope at × 200 magnification, and adipocyte cell sizes were measured using the Image J software (NIH, USA) [20]. A minimum of 200 adipose cells per slide were counted.
Statistical analysis
Statistical analyses were performed using the GraphPad Prism® software (version 8.0; San Diego, CA, USA). Values are presented as means ± standard error of mean (SEM). Differences among the three groups were analyzed using the nonparametric Kruskal-Wallis test. If a statistical difference was accepted, group comparisons were performed using Dunn’s pairwise post-hoc test with Bonferroni multiple-testing correction21. Statistical significance was set at p < 0.05.
RESULTS
Age-induced obesity appears to be an increase in adipose mass and a decrease in SM weight
Body weight and body composition (fat, fluid, and lean) were evaluated to assess age-related fat mass increase. As expected, the body weight of 24 M mice was significantly higher than that of 2 M mice. This result was mostly due to increased fat tissue, as indicated by the body composition analysis results. In contrast, lean mass decreased with age (Figure 1A). Both gWAT and BAT weights were significantly increased in the 24 M mice compared to those in the 2 M mice. Still, SM mass was not significantly different among the groups (Figure 1B). In addition, the gWAT/body weight ratio increased in the 24 M mice compared to that in the 2 M mice. In contrast, the SM mass/body weight ratio showed the opposite trend (Figure 1C). However, aging did not affect relative BAT mass (BAT/body weight).
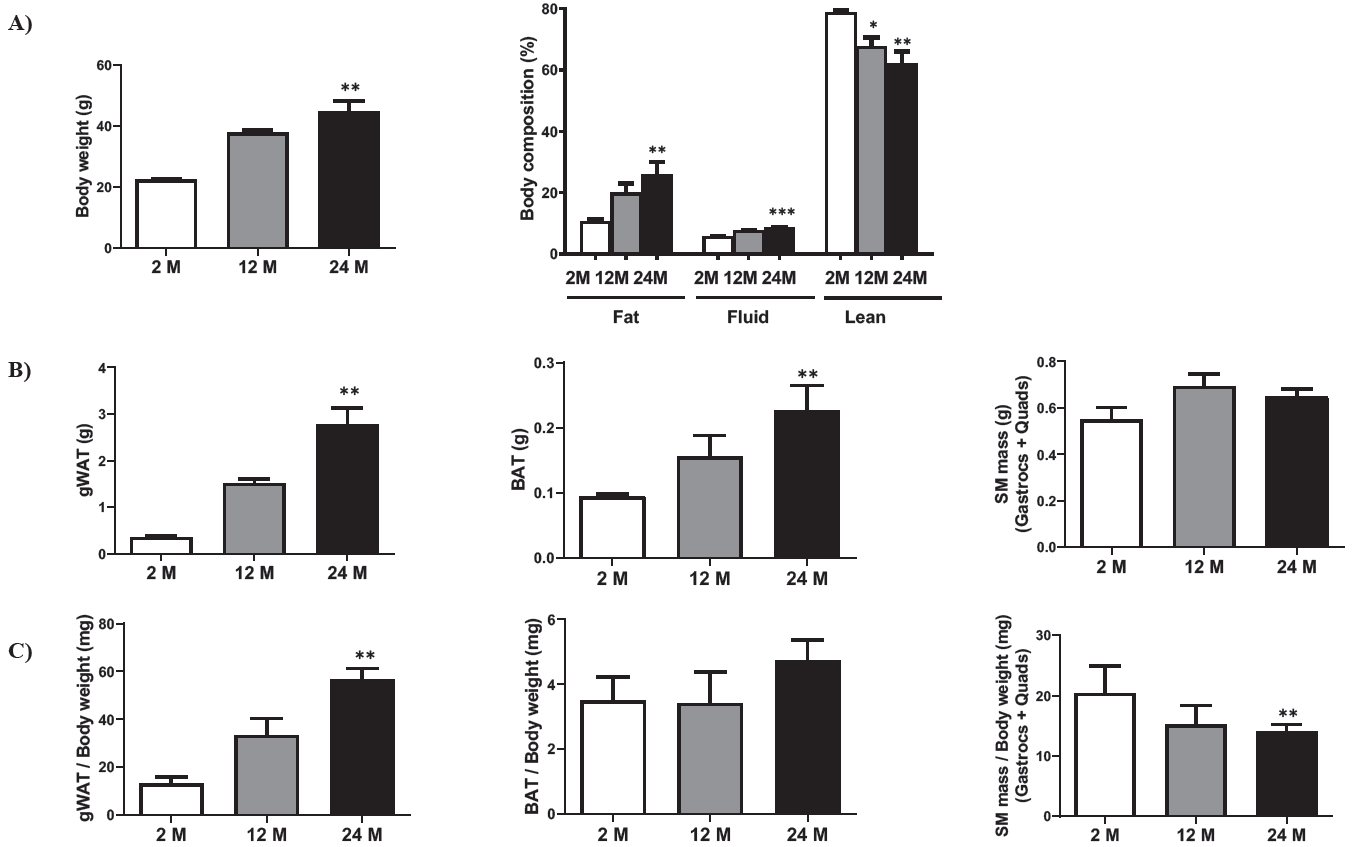
Changes in fat mass and skeletal muscle mass according to age. (A) Changes in body weight and body composition according to age groups: 2-month-old (2 M), 12-month-old (12 M), and 24-month-old (24 M). Eight mice were assigned to each group. (B) Absolute weight in the gWAT, BAT, and SM according to age. (C) Relative weight (tissue weight per body weight) in the gWAT, BAT, and SM according to age. gWAT, gonadal white adipose tissue; BAT, brown adipose tissue; SM, skeletal muscle; Gastrocs, gastrocnemius; Quads, quadriceps. Data are presented as means ± SEM. Significant differences are denoted by an asterisk for p < 0.05 (*), p < 0.01 (**), and p < 0.001(***) compared to 2 M.
Aging-induced obesity reveals adipocyte hypertrophy, but does not regulate adipogenesis-related transcription factors
To distinguish the histological features of age-related obesity in different types of adipocytes, we directly measured adipocyte size in the gWAT and BAT. Adipocyte size significantly increased by almost two-fold during aging (Figure 2A). The relative gene expressions of adipogenesis-related transcription factors (PPAR-α, PPAR-γ, C/EBP-α, C/EBP-β, and aP2) were examined in the gWAT, BAT, and SM (Figure 2B). None of these five markers changed significantly with aging in the gWAT and SM. However, the PPAR-γ mRNA expression level in the BAT of 12 M mice was approximately three-fold higher than in the 2 M mice. Thus, these results imply that the increase in WAT mass and adipocyte size may be primarily due to increased adipogenesis during aging, which may contribute to age-related obesity.

Effects of aging on morphological changes and adipogenesis-related gene transcriptional levels in gWAT, BAT, and SM tissues. (A) Changes in adipocyte size by hematoxylin & eosin staining. (B) mRNA levels of adipogenesis-related transcription factors (PPAR-α, PPAR-γ, C/EBP-α, C/ EBP-β, and aP2) in the three age groups: 2-month-old (2 M), 12-month-old (12 M), and 24-month-old (24 M). Five mice were assigned to each group. gWAT, gonadal white adipose tissue; BAT, brown adipose tissue; SM, skeletal muscle. PPAR-α, peroxisome proliferator-activated receptor-alpha; PPAR-γ, peroxisome proliferator-activated receptor-gamma; C/EBP-α, CCAAT/enhancer-binding protein-alpha; C/EBP-β, CCAAT/enhancer-binding protein-beta; aP2, adipocyte protein 2. Data are presented as means ± SEM. Significant differences are denoted by an asterisk for p < 0.05 (*) and p < 0.01 (**) compared to 2 M.
Among adipokines, changes in leptin sensitivity with age are likely to contribute to aging-related obesity
The basal transcriptional levels of adipokines, including adiponectin, leptin, and TNF-α mRNA expression were studied in the gWAT, BAT, and SM (Figure 3A). No significant modification was observed in adiponectin mRNA levels among the tissues. Moreover, none of the three tissues were affected in an age-dependent manner (Figure 3B). There was a significantly lower leptin mRNA level in the SM than in the gWAT. It showed the highest leptin mRNA gene expression among the gWAT, BAT, and SM tissues in the 24 M mice compared to 2 M mice (Figure 3A and 3B). The TNF-α mRNA gene was not expressed in the tissues and was not affected by aging (Figure 3A and 3B).
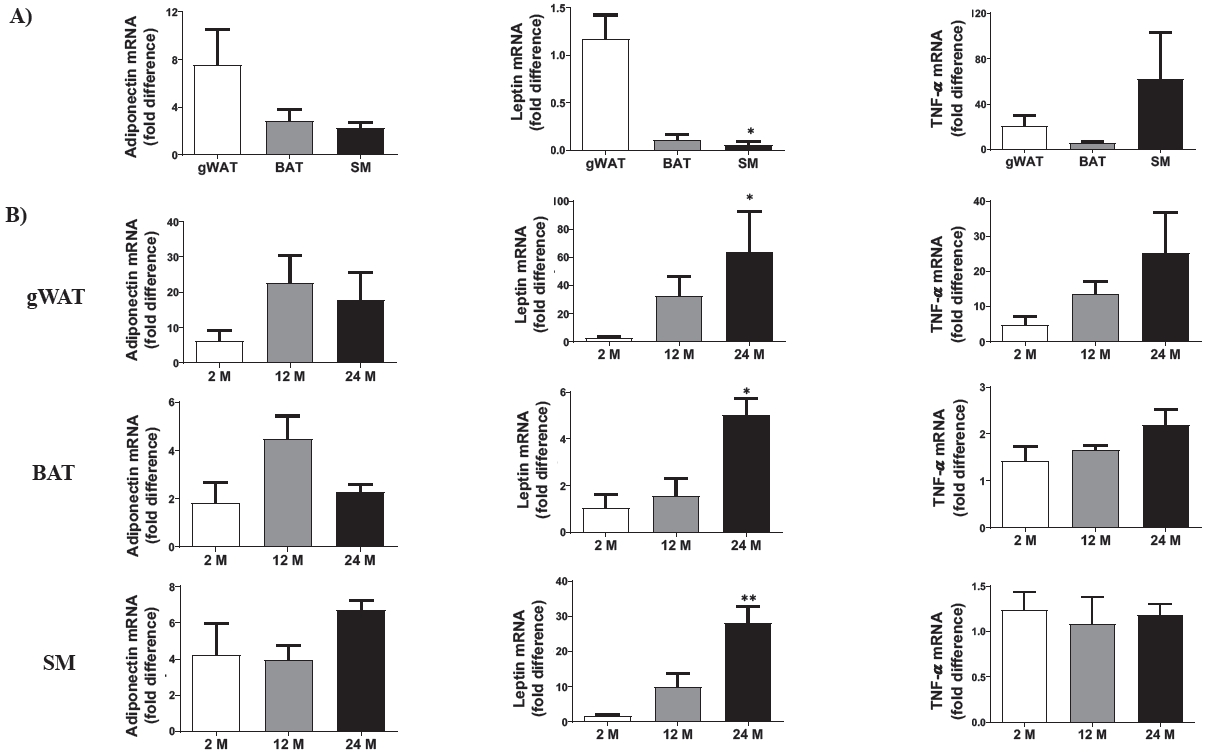
Effects of aging on adiponectin, leptin, and TNF-α mRNA expression in gWAT, BAT, and SM tissues. (A) The relative basal mRNA levels among gWAT, BAT, and SM in 2-month-old mice. (B) Transcriptional levels of adiponectin, leptin, and TNF-α in the gWAT, BAT, and SM in the three age groups: 2-month-old (2 M), 12-month-old (12 M), and 24-month-old (24 M). Five mice were assigned to each group. gWAT, gonadal white adipose tissue; BAT, brown adipose tissue; SM, skeletal muscle. Data are presented as means ± SEM. Significant differences are denoted by an astersik for p < 0.05 (*) and p < 0.01 (**) compared to either gWAT or 2 M.
Tissue-specific regulation of β-ARs rather than MAOs is associated with aging-related obesity
The SNS innervates tissues by expressing the related receptors. Transcriptional levels of the three subtypes for β-ARs, such as ADRB1, ADRB2, and ADRB3, were quantified in the target tissues. Their basal expression levels were differentially regulated in a tissue-specific manner; ADRB1 mRNA levels were not significantly changed among the tissues, ADRB2 mRNA levels were significantly upregulated in the SM, and ADRB3 mRNA levels were downregulated in the SM (Figure 4A). During aging, neither ADRB1 nor ADRB3 mRNA levels were significantly altered in the target tissues. However, ADRB2 mRNA levels increased dramatically in the gWAT and SM but decreased in the BAT (Figure 4B).

Effects of aging on β1-, β2-, and β3-adrenergic receptor transcriptional levels in gWAT, BAT, and SM tissues. (A) The relative basal mRNA levels of three subtypes of β1-, β2-, and β3-adrenergic receptors among gWAT, BAT, and SM in 2-month-old mice. (B) Transcriptional levels of ADRB1, ADRB2, and ADRB3 in gWAT, BAT, and SM in the three age groups: 2-month-old (2 M), 12-month-old (12 M), and 24-month-old (24 M). Five mice were assigned to each group. gWAT, gonadal white adipose tissue; BAT, brown adipose tissue; SM, skeletal muscle. Data are presented as means ± SEM. Significant differences are denoted by an asterisk for p < 0.05 (*) and p < 0.01 (**) compared to either gWAT or 2 M.
MAOs are responsible for degrading serotonin, dopamine, adrenaline, and noradrenaline. These enzymes are localized in the outer mitochondrial membrane with two isoforms, A and B, which have emerged as crucial factors in dysfunctional adipose tissue22. They are involved in controlling obesity by regulating the adrenergic tone. Therefore, the transcriptional levels of MAO-A and MAO-B were examined in the target tissues (Figure 5A). MAO-A mRNA level was highly expressed in the SM compared to that in the gWAT and BAT. In addition, the mRNA levels of MAO isoforms in gWAT and BAT were not significantly different (Figure 5B). MAO-A mRNA levels were not age-dependently expressed in the SM. However, MAO-B mRNA levels were particularly affected in the 24 M mice. Interestingly, IHC staining for MAO-B protein levels showed stronger excitation during aging in the BAT than in the gWAT. In addition, the translational level of GABA, produced by MAOs, was enhanced in the BAT compared to that in the gWAT (Figure 5C). Thus, these data show that aging-induced obesity may be affected by tissue-specific regulation of β-ARs, especially ADRB2, rather than by MAOs expression.

Effects of aging on MAO-A and MAO-B mRNA expression in gWAT, BAT, and SM tissues. (A) The relative basal mRNA expression levels of MAO-A and MAO-B among gWAT, BAT, and SM in 2-month-old mice. (B) Transcriptional levels of MAO-A and MAO-B in gWAT, BAT, and SM in the three age groups: 2-month-old (2 M), 12-month-old (12 M), and 24-month-old (24 M). Five mice were assigned to each group. (C) MAO-B and GABA protein expression levels by immunohistochemical staining. MAO-A, monoamine oxidase-A; MAO-B, monoamine oxidase-B; GABA, gamma-aminobutyric acid; gWAT, gonadal white adipose tissue; BAT, brown adipose tissue; SM, skeletal muscle. Data are presented as means ± SEM. Significant differences are denoted by an asterisk for p < 0.05 (*) compared to 2 M; a dagger for p < 0.05 (†) compared to 12 M.
Thermogenesis-related genes are involved in aging-induced obesity
The transcriptional levels of thermogenesis-related genes, such as PGC-1α, Cox7a1, Cox8b, UCP-1, and CIDE-A, were analyzed in the gWAT, BAT, and SM (Figure 6A). Basal transcriptional levels of PGC1-α, Cox7a1, and Cox8b were higher in the SM than in the gWAT. However, both UCP-1 and CIDE-A mRNA levels were significantly upregulated in the BAT compared to those in the gWAT; however, the UCP-1 mRNA levels downregulated in the SM. As shown in Figure 6B, the mRNA expression levels of these genes appeared to be differentially regulated in the adipose (gWAT and BAT) and SM tissues during aging. Specifically, the expression of the abovementioned thermogenesis-related target genes were not significant responses in the gWAT. However, their activities were sensitive to increased UCP-1 and PGC-1α mRNA levels, in the BAT and SM of the 12 M mice, respectively, compared to those of the 2 M mice. Increased UCP-1 mRNA expression in the 12 M mice than in the 2 M mice significantly returned to the baseline level.
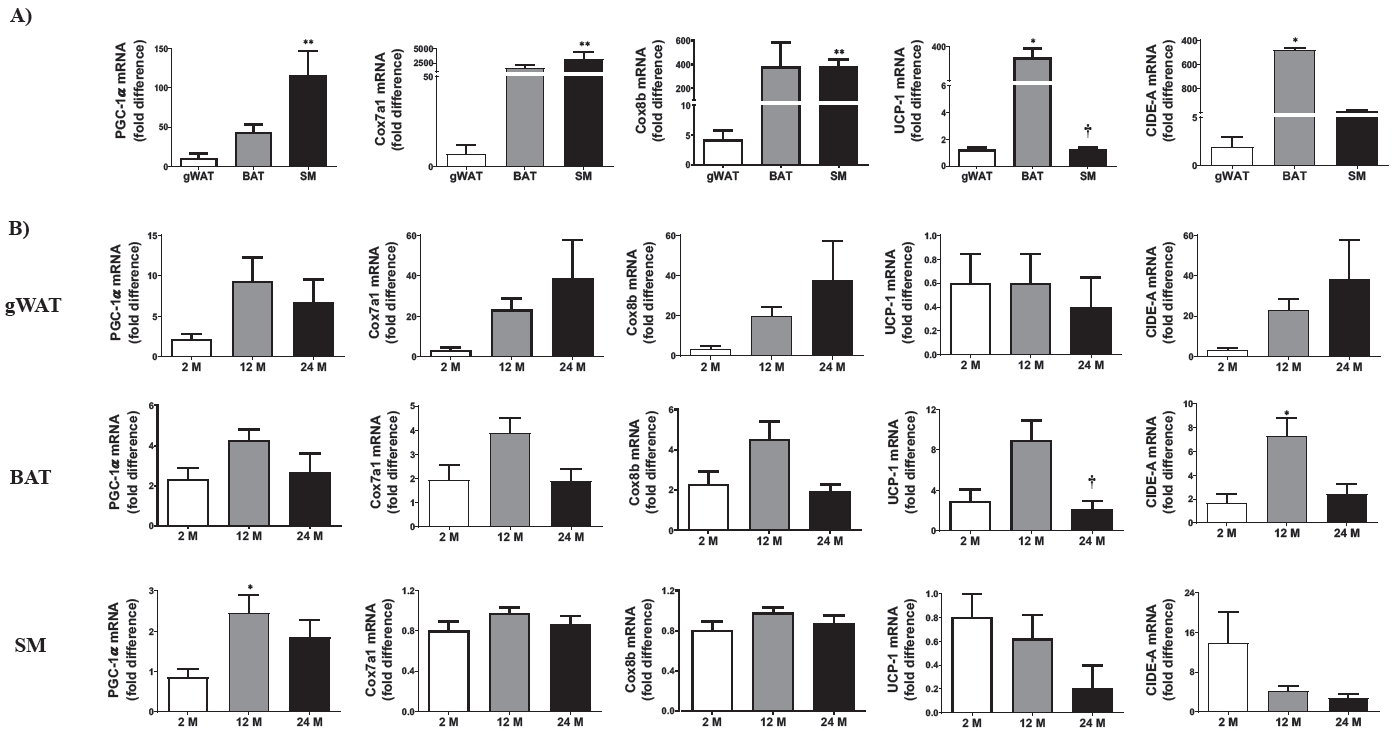
Effects of aging on thermogenesis-related gene transcriptional levels in gWAT, BAT, and SM tissues. (A) The relative basal expression levels of thermogenesis-related genes (PGC-1α, Cox7a1, Cox8b, UCP-1, and CIDE-A) among gWAT, BAT, and SM in 2-month-old mice. (B) Transcriptional levels of thermogenic-related genes in gWAT, BAT, and SM in the three age groups: 2-month-old (2 M), 12-month-old (12 M), and 24-month-old (24 M). Five mice were assigned to each group. PGC-1α, peroxisome proliferator-activated receptor gamma coactivator 1-alpha; Cox7a1, cytochrome c oxidase subunit 7A1; Cox8b, cytochrome c oxidase subunit 8b; UCP-1, uncoupling protein-1; CIDE-A, cell death-inducing DFFA-like effector a; gWAT, gonadal white adipose tissue; BAT, brown adipose tissue; SM, skeletal muscle. Data are presented as means ± SEM. Significant differences are denoted by an asterisk for p < 0.05 (*) and p < 0.01 (**) compared to 2 M; a dagger for p < 0.05 (†) compared to 12 M.
DISCUSSION
Obesity can be induced by aging, and a calorie-rich diet and is known to be closely associated with chronic metabolic diseases and inflammation. Remarkably, recent research findings suggest that it is necessary to understand the concepts of diet-induced obesity and age-related obesity, since the cellular and molecular mechanisms of aging and obesity overlap [23,24]. Thus, we focused on the latter topic and identified which candidate genes were susceptible to aging-related obesity and whether they may be relevant to adipogenesis and thermogenic metabolism among two distinct types of adipocytes (white and brown) and SM tissues in spontaneously aged mice.
The development of age-related obesity in the experimental subjects is shown in Figure 1 Body weight, absolute fat mass (including gWAT and BAT), and relative gWAT mass dramatically increased, but the SM mass/body weight ratio showed the opposite trend. Previous studies suggested that age-related changes in body composition promoted an increment of fat mass and a loss of SM mass due to a decreased resting metabolic rate and physical activity [25,26]. Consistent with our results, a recent comparative study using male old (18-month-old) and young (6-month-old) mice indicated that the age-related increase in body weight was mainly due to an increase in fat mass [19].
Next, we measured the size of gWAT and BAT and identified that aging-related obesity was associated with adipocyte hypertrophy. Ironically almost all adipogenesis-related transcription factors (PPAR-α, PPAR-γ, C/EBP-α, C/EBP-β, and aP2) were not determinants of natural aging, except for PPAR-γ. With respect to the upregulated BAT PPAR-γ in the 12 M mice compared to that in the 2 M mice, PPAR-γ is required for the chronic survival and homeostasis of adipocytes; however, its absence results in a significant loss of fat cells and compensatory hypertrophy [27]. It is also essential to maintain the thermogenic activity of the mature BAT, which can be induced by activating β-adrenergic signaling [28].
Peroxisome proliferator-activated receptors (PPARs) are important age-associated pathophysiological regulators of cellular energy metabolism and oxidative stress [29]. They also play a role in obesity by regulating glucose metabolism, adipocyte differentiation, lipid breakdown, and fat depot. PPAR-γ expression and activity were decreased in senescence-accelerated mice, which may contribute to the age-related loss of function. In addition, selective surgical removal of PPAR-γ in the subcutaneous adipose tissue was stimulated with increased adiposity and insulin resistance [30].
Adipokines, such as adiponectin, leptin, and TNF-α, play important roles in recruiting immune cells to the adipose tissue, which is downregulated in obesity. Adiponectin positively correlates with anti-inflammatory effects in the adipose tissue by regulating production of cytokine in adipocytes and polarization of the adipose tissue macrophages toward an anti-inflammatory M2 phenotype [31]. Leptin, a typical adipokine, is released by adipocytes, and changes in lectin levels are associated with both weight gain and weight reduction [32]. The SM tissue also secretes leptin and contains abundant leptin receptors [33,34]. Additionally, leptin resistance has been observed in the brains of older rodents, suggesting that altered leptin signaling may be a significant factor in the aging process [35]. Thus, our data indicate that the upregulation of leptin mRNA levels during aging may be strongly affected by age-related obesity in metabolic tissues, such as the adipose and SM tissues.
The β-ARs are a class of G protein-coupled receptors; they are targets of many catecholamines, such as noradrenaline and adrenaline, produced by the body. There are three subtypes (β1-, β2- and β3-ARs), and binding of a catecholamine to the receptor will generally stimulate the SNS. Both β1- and β2-ARs are extensively expressed throughout body tissues, whereas the β3-AR is predominantly found in adipocytes. Stimulating β-ARs affects the mobilization of stored fatty acids and secretion of fat-cell-derived hormones, thereby contributing to lipolysis in the WAT and non-shivering thermogenesis in the BAT [36]. Although the ability of the β-ARs system to promote thermogenesis and lipolysis is impaired in obese animal models, selective β3-AR agonists have been suggested as effective anti-obesity agents as they help to increase energy expenditure, thereby managing obesity [37]. However, our results showed that augmented ADRB2 mRNA levels in the gWAT correlated with the progression of age-related obesity, rather than ADRB1 or ADRB3 transcriptional levels. Evidence indicates that ADRB2 gene variation is linked to reduce in vivo lipolysis and fat oxidation in overweight and obese subjects [38]. Thus, ADRB2 antagonists targeting the gWAT could be used as novel therapeutic agents for preventing or delaying the development of age-related obesity.
MAO-A and MAO-B are encoded by two genes on the X chromosome and are associated with normal brain function. MAOs structurally contain flavin adenine dinucleotide as a cofactor and functionally contribute to the degradation of endogenous catecholaminesb [18]. Aging causes a reduction in catecholamine-induced lipolysis, and a deficiency in FFA mobilization is associated with increased visceral adiposity in older adults; however, MAO-A inhibition is known to improve age-related noradrenaline content in the adipose tissue [17]. A previous study showed that MAO-A mRNA levels in murine sWAT were 3-fold higher in old (12-monthold) mice than in young (6-week-old) mice [12]. In contrast, our data showed that neither MAO-A nor MAO-B mRNA levels were affected by the loss of adrenergic activity during aging in both gWAT and BAT. Additionally, GABA showed a higher affinity toward its antibody in the BAT than in the gWAT, and GABA production in the BAT tended to increase with aging. The increment of GABA production with aging might be associated with BAT dysfunction. Indeed, GABA signaling contributes to BAT and mitochondrial dysfunction with a whitened BAT in obese mice [39]. Conversely, genetic inactivation or inhibition of the GABA-type B receptor subunit 1 (GABA-BR1) results in the re-browning of BAT under metabolic stress conditions and ameliorates systemic glucose intolerance. These findings suggest that obesity enhances BAT dysfunction and systemic metabolic disturbances via GABA/GABA-BR1 signaling.
In general, transcription factors involved in the direct or indirect regulation of energy metabolism play key roles under pathogenic conditions. PGC-1 family members are transcriptional co-regulators participating in diverse metabolic pathways acting as “molecular switches” [40]. In particular, the biological roles of PGC-1α have been well-known for adaptive thermogenesis, mitochondrial biogenesis, gluconeogenesis, fatty acid oxidation, and skeletal muscle-fiber type shifting [41]. PGC-1α expression is upregulated in multiple tissues, such as the BAT, heart, SM, kidney, and brain, but is relatively downregulated in the liver and WAT [42,43]. Our data showed that it was the highest in the SM of middle-aged adult (12-month-old) mice compared to that in the gWAT and BAT of young (2-month-old) mice. This outcome may be associated with the transformation of myofiber types, which are required to complete normal growth and development from young to middle-aged adults, regardless of the onset of aging.
The cytochrome c oxidase subunit isoform, Cox7a1, is a brown adipocyte marker gene and a cold-sensitive protein in the BAT. It is strongly expressed in SM and cardiac tissues and has a higher oxidative capacity [44]. In addition, Cox7a1 is enriched in the WAT upon cold exposure in young mice, and deletion of the Cox7a1 isoform leads to decreased capillarity and reduced energy production in the SM of mice [45,46]. Our data showed that Cox7a1 mRNA levels were highly regulated in the SM compared to those in the gWAT of young (2-month-old) mice; however, Cox7a1 expression did not require recruitment by age-induced obesity in adipose or SM tissues.
Following the putative thermoregulatory markers, Cox8b, UCP-1, and CIDE-A were recommended as the optimum agents for the assessment of BRITE (brown-in-white) adipocytes, which were age-dependent beige adipocyte markers in an in vivo study [47]. UCP-1 is a mitochondrial membrane protein strongly expressed in rats exposed to cold temperatures and is likely involved in BAT thermogenesis [48]. UCP-1 converts the high oxidation rates in brown adipocytes into heat production, rather than ATP synthesis, to defend against cold stimulation. Conventional brown/beige thermogenesis is regulated by β3-AR activation, which is affected by noradrenaline release, and cAMP-dependent signaling triggers lipid oxidation [49]. Therefore, its activity is considered to be a protective mechanism against obesity. Our data showed that UCP-1 mRNA expression was highly upregulated in the BAT than in the gWAT of young (2-month-old) mice, but downregulated in old (24-month-old) mice. Thus, the age-related reduction in UCP-1 mRNA levels in the BAT is strongly involved in age-related obesity.
CIDE-A belongs to the CIDE family of proteins, which are important regulators of lipid droplet (LD) fusion and growth in the adipose tissue, liver, skin, and mammary glands [50]. CIDE-A is a crucial regulator of energy balance and adiposity because a study on CIDE-A-deficient mice revealed that the null mice were slim and unsusceptible to diet-induced obesity [51]. Consistent with previous findings, our data showed that the relative basal level of CIDE-A peaked in the BAT rather than in the gWAT and SM, and its expression in the BAT was the highest in middle-aged adult (12-month-old) mice. However, its expression did not affect the resistance to aging-related obesity.
Unfortunately, this study is limited by a lack of data on food intake for each group. Thus, we recommend assessing both food intake and body composition in future experimental studies on aging-related obesity.
In conclusion, prominent transcription genes supporting aging-induced obesity were associated with increased leptin levels in adipocytes and SM tissues and decreased UCP-1 levels in BAT. Notably, exercise training-induced adaptations result in reduced leptin levels and enhanced thermogenic properties of adipocytes in aging-induced obesity [52,53]. Therefore, further studies are required to develop more effective strategies for preventing age-related obesity, such as exercise-induced WAT browning.
Acknowledgements
This research was supported by the Basic Science Research Program through the National Research Foundation of Korea (NRF) funded by the Ministry of Education (2018R1D1A1B07048706, 2021R1F1A1048536, and 2022R1I1A1A01068531). We would like to thank Editage (www.editage.co.kr) for English language editing.