Analysis of physiological tremors during different intensities of armcurl exercises using wearable three-axis accelerometers in healthy young men: a pilot study
Article information
Abstract
[Purpose]
The purpose of this pilot study was to determine whether physiological tremors (PTs) assessed using an accelerometer could be used to evaluate resistance exercise intensity.
[Methods]
Twenty healthy young men with no prior experience of resistance exercise were recruited. Different intensities (resting, 30%, 50%, and 70% of their predetermined one-repetition maximum (1-RM)) of arm-curl exercise were used to elicit PT. The total work was held equally by varying the number of repetitions, with five sets for each intensity. Sessions of varying intensities were performed randomly with a washout period of at least a week. PT responses were recorded during exercise using accelerometers (3-axis) attached to the wrist and ear. Electromyography (EMG) data were obtained from the biceps brachii muscle during exercise. PT and EMG data were expressed as the average root mean square index.
[Results]
The EMG amplitude increased significantly as exercise intensity increased. Furthermore, PT amplitude significantly increased as exercise intensity increased. Moreover, the Borg rating of perceived exertion (RPE) and lactic acid levels increased significantly. The wrist PT was related to ear PT, EMG, RPE, and lactic acid levels. Additionally, ear PT was associated with EMG, RPE, and lactic acid levels.
[Conclusion]
This pilot study identified changes in PT during resistance exercise at different intensities. We suggest that the use of PT analyses during these exercises provides a more intuitive delineation of resistance exercise intensity and fatigue.
INTRODUCTION
Prescribed exercise is a plan designed for a specific health-related purpose. Evidence suggests that physical exercise has a positive effect on the cardiovascular system and skeletal muscles, and reduces the risk of diseases, such as diabetes, cancer, and depression [1].
Exercise can be generally categorized into aerobic and resistance exercises, and should be of appropriate duration and intensity for the purpose of health-related activities [2,3]. Being aware of exercise duration and intensity is important for optimized benefits of exercise, whereas inappropriate intensity could lead to excessive exhaustion, injuries, and consequent lack of exercise motivation [4,5]. The required exercise duration can be simply measured using a stopwatch; however, the exercise intensity is difficult to measure immediately. Thus, the intensity of aerobic exercise has been widely prescribed and monitored using a variety of methods, including heart rate (HR), percentage of maximal oxygen uptake, and rating of perceived exertion (RPE) [6]. However, resistance training and/or weightlifting activities are unable to reflect aerobic training intensity methods, owing to the influence of loads.
Although there is a discrepancy in measuring the intensity between aerobic and resistance exercises, RPE is a versatile marker for anaerobic training load incorporating both physiological (i.e., metabolic acidosis, ventilation, and oxygen uptake) and psychological stress against intensity response [7]. Typically, increased RPE indicates an increased percentage of one-repetition maximum (1-RM) during resistance [7,8]. Evidence also indicates that RPE is a simple and reliable method for representing and monitoring performance [9,10]. However, it is important to understand that multiple factors may affect RPE. Further, RPE has an inevitable drawback in that it detects self-perceived intensity of exercise. The data available for evaluating exercise intensity is limited. Therefore, alternative methods are required to solve this problem.
Physiological tremor (PT) is defined as a rhythmic, involuntary, and mechanical oscillatory movement disorder. PT is caused by defects in motor units, mechanical resonance, peripheral stretch reflex loops, and summation of contraction strengths arising from the central nervous system [11].The tremor throughout whole body is can be indicative of muscular fatigue; anxiety; and emotional stress, such as fear and excitement in healthy persons. Previous studies have shown that PT, specifically peripheral tremor, is used for a variety of purposes, including measuring precision in sports such as pistol shooting [12] and archery [13], and is a new method of quantitative tremor assessment in sports and clinics. This method is based on the assessment of muscle fatigue. In this context, it is likely that intensity via PT is relevant in resistance exercise as tremors are highly correlated with muscle exertion [14]. A tremor of small amplitude may not be seen with the naked eye, therefore sensitive recording devices are essential for their detection [15]. Several devices, such as accelerometers, electromyographs (EMG), lasers, mechanical devices, and condenser microphones, have been recommended for tremor measurement. Among these, the accelerometer is the most widely used as it is a simple, cost-effective, and a validated diagnostic tool [16].
To the best of our knowledge, no study has provided valid and quantitative methods for evaluating exercise intensity during resistance exercise. Therefore, we investigated whether PT using a set of wearable accelerometers attached to the wrist (for peripheral tremor) and ear (for whole-body tremor) of participants can be used to classify the different intensities during resistance exercise.
METHODS
Subjects
Twenty healthy young males were recruited from Korea University and local areas through flyers and online means (Table 1). The sample size was determined with an ES: f = 0.5(y2 = 0.2) α level of 0.05, and power of 0.80, indicating that 20 participants were sufficient to participate in this study. Participants without regular resistance exercise habits or known neuromuscular problems were recruited for this study based on a physical activity readiness questionnaire (PAR-Q). The subjects must have been able to perform the arm curl exercise. Subjects were asked to fast and refrain from alcoholic beverages, caffeine, and food for at least 12 h prior to the experiments. The nature of the study was explained to the participants, and they were asked to read and sign an informed consent form that was reviewed and approved by the Institutional Review Board of Korea University (KU-IRB-17-210-P-1).
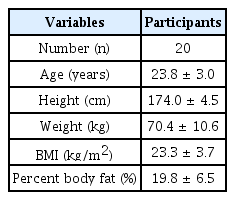
Selected participant characteristics.
Experimental procedure
We used a within-subjects repeated-measures design, in which all subjects performed four trials (i.e., baseline (0%), 30%, 50%, and 70% of one-repetition maximum (1-RM)), randomly at least one week apart with a pre-determined (1-RM). The study was performed using a resistance training protocol at rest and during arm curl exercise with a matched total volume across the entire bout. The matched total volume was manipulated using resistance, reps, and sets. Two variables, resistance and reps, were altered in natural settings that increased the load and naturally reduced the reps, however, the number of sets were fixed to be the same.
The subjects completed the initial trial used to determine the 1-RM for the arm curl. 1-RM was estimated using O’Conno’s equation formula [17]. Based on the pre-determined 1RM, participants performed experimental trials consisting of the aforementioned exercise following four protocols: (a) baseline at 0% of 1-RM, (b) 30% of 1-RM; resistance × 12 reps × 5 sets at 30% of 1-RM; (c) 50% of 1RM; resistance × 7 reps × 5 sets at 50% of 1-RM; and (d) 70% of 1RM; resistance × 5 reps × 5 sets at 70% of 1-RM. The actual resistance did not differ from the estimated resistance because of instrumental artifacts. Exercise was performed randomly and at least one week apart to avoid fatigue after a bout of exercise. In addition, subjects were asked to avoid vigorous exercise during the exercise performed in this study and to perform their regular activities. The subjects performed arm-curl exercises with 1-s concentric and 1-s eccentric contractions (approximately 100–110 degrees). The subjects repeated the contractions at a constant rep velocity and frequency with a metronome. No warm-up was performed prior to the exercise. A 30-s rest period was provided between exercise sets [18]. Participants were encouraged to complete all reps in all trials within 5 min, which was necessary for the same volume, and to refrain from the Valsalva maneuver during exercise.
We prepared the subjects’ skin for EMG data recording by following these steps: (a) washing the EMG adhesion area of the skin with soap and warm water, (b) shaving the area if necessary, (c) wiping the region with alcohol to remove foreign substances and oil, (d) abrading the electrode sites lightly using fine-grade emery paper and pencil erase [19].
Wearable accelerometers (Accelerometers; InvenSense, USA) were mounted on the wrist and ear of each participant. Figure 1 illustrates the accelerometer placement and the position of the wrist and ear during the test. Bipolar Ag/AgCl EMG surface electrodes were positioned over the belly of the biceps brachii muscle of the arm to measure the muscle activity during exercise. Electrode pairs were placed parallel to the underlying muscle fibers (inter-electrode distance = 2 cm). EMG signals were amplified using Coulboum Isolated Bioamplifiers (Biopac Systems Inc. USA). During the experimental trials, the HR via a polar HR monitor (Polar Inc., Port Washington, NY), lactate level (Lactate Pro2, Cosmed, Rome, Italy), and RPE were measured prior and post exercise.
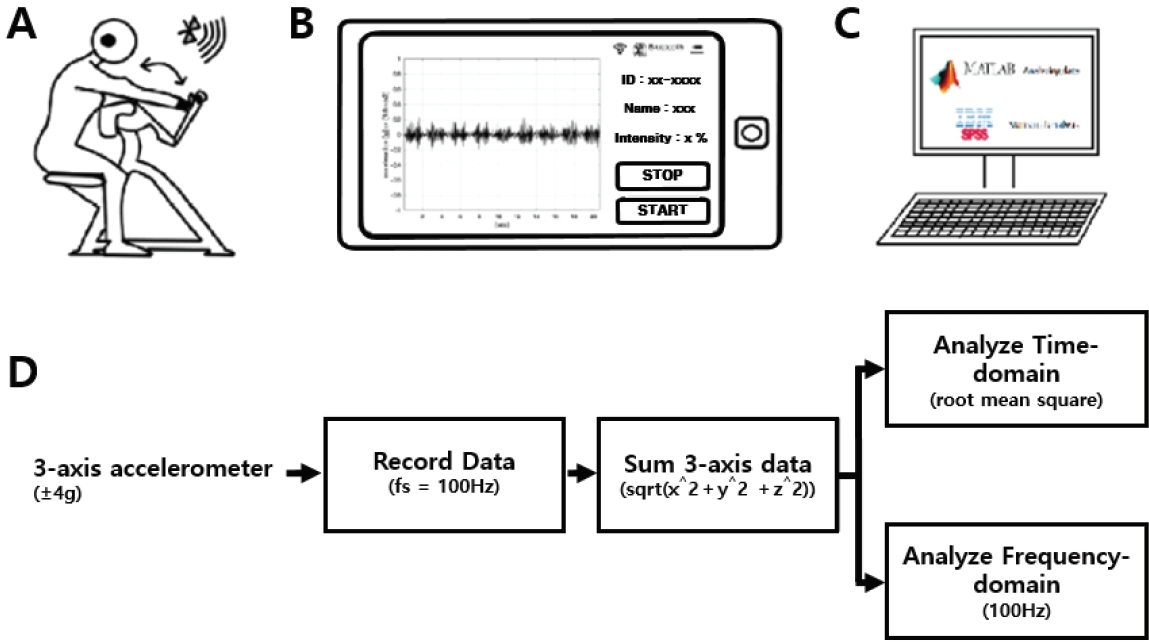
Experimental setting with the subject during arm-curl resistance exercise, EMG and physiological tremor recordings (A-C), and extraction method for the time-domain and frequency-domain (D). A: arm-curl exercise; B: tremor recording with accelerometer; C: data analysis using MATLAB and statistical analysis using SPSS.
Tremor recording & preprocessing
The 3-axis acceleration data were measured using an MPU-9250 MotionTracking device (Invensense, LG Electronics, Korea). The range of acceleration was set at ± 4 g (g=9.8 m/s^2) and the sampling frequency was 100 Hz. The Vectorsum equation (sqrt (x^2+y^2+z^2)) was used to change 3-axes acceleration to 1-axis data . The root mean square was used for the time-domain analysis, and the fast Fourier transform (FFT) was used for the frequency-domain analysis (Fig 2).
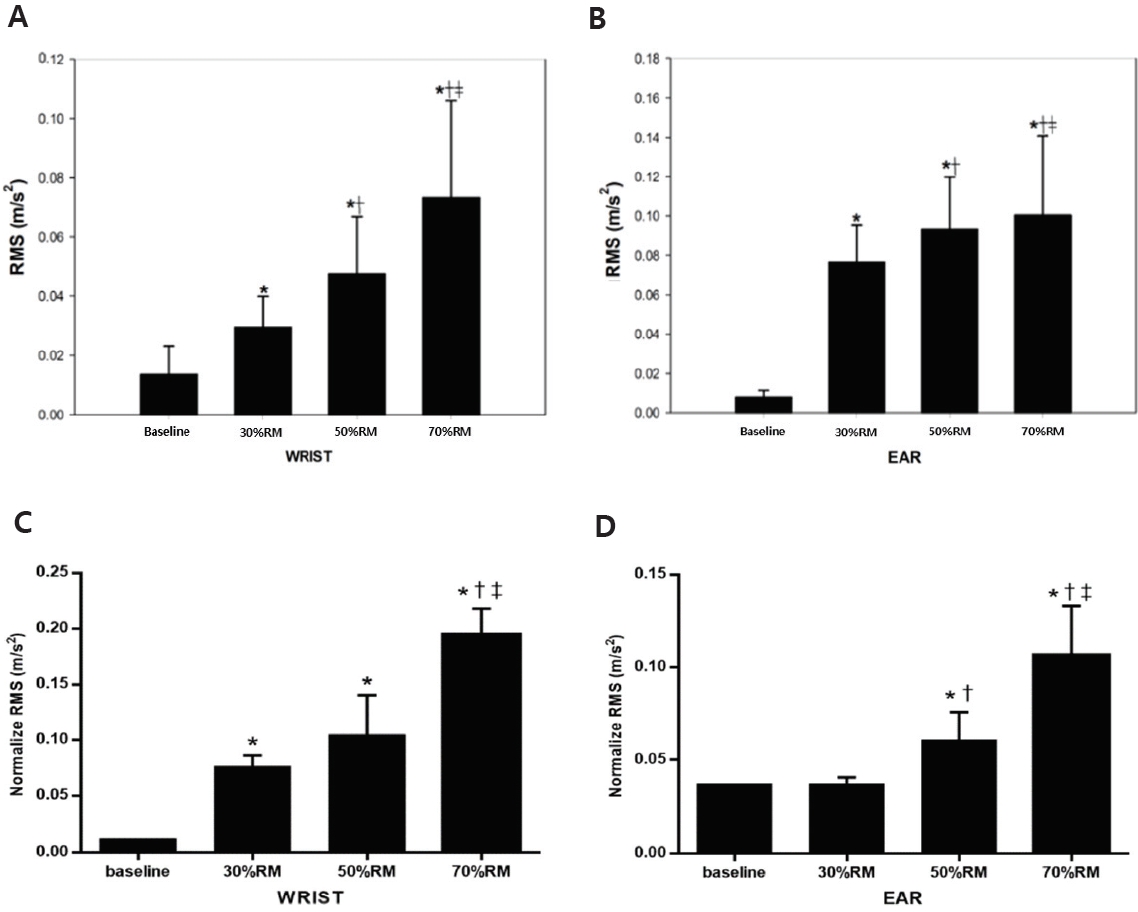
Box-and-whisker plot of root mean square (RMS) calculated by the amplitude of wrist (A) and ear (B) tremors during arm-curl exercise among different intensities. Wrist (C) and ear (D) tremors were calculated as the normalized root mean square (RMS) during arm-curl exercise among different intensities. Values are expressed as mean± S.D. * p<.05 vs. baseline (0%), † p<.05 vs. 30% RM, ‡ p< .05 vs. 50% RM.
Lactate
Blood lactate concentration was measured using a lactate analyzer (Lactate Pro 2, Cosmed, Rome, Italy). Blood samples were collected using the fingertip method. Blood lactic concentration was measured post-exercise (baseline (0%) and 30%, 50%, and 70% of one repetition maximum).
Statistical analysis
One-way repeated-measures analysis of variance (ANOVA) was used to determine the effect of intensity on dependent variables (e.g., PT, EMG, lactate, and RPE). When a significant F value was observed, a post-hoc test (Bonferroni correction) was performed to determine significant differences among intensities. Bivariate correlations were used to determine the relationships between the dependent variables (Pearson’s correlation coefficient). All data are expressed as the mean± standard deviation unless otherwise stated. A significance level of α < 0.05 was used to determine statistical difference. SPSS version 22 (IBM Corp., Armonk, NY, USA) was used for all the statistical analyses.
RESULTS
The results showed that as the intensity of arm-curl exercise increased (baseline (0%), 30%, 50%, and 70% of 1-RM) with an equal total volume, there was a corresponding increase in EMG, lactic acid, and RPE. The results are presented in Table 2. The EMG data were significantly higher with increased exercise intensity for the matched total workload. The analysis revealed significant effects of lactic acid (P<.01). Post-hoc analyses using the Bonferroni correction showed that the lactic acid level increased as the intensity increased. However, 30% and 50% of 1-RM were not significantly different. The RPE was significantly different from the increased intensities (P<.01).
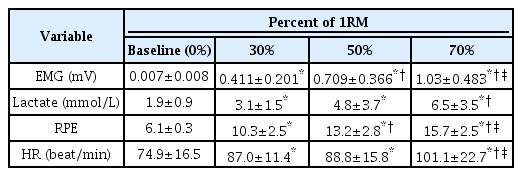
Descriptive values of EMG, lactic acid, RPE, and HR for all trials.
Table 2 shows that wrist PT was related to ear PT (r=0.512; P<.001), as well as to EMG (r=0.642; P< .001), RPE (r=0.668; P<.001), and lactic acid (r=0.498; P<.001). In addition, ear PT was associated with EMG (r=0.674; P<.001), RPE (r=0.612; P<.001), and lactic acid (r=0.572; P<.001).
Figure 2 illustrates the differences in exercise intensity in the wrist (A) and ear (B) PT. Wrist PT showed significant main effects (P<.01), and ear PT also significantly increased with an increase in intensity. (C) and (D) show the normalized values according to the difference in exercise intensity between the wrist and the ear. The 30%, 50%, and 70% wrist PT were significantly higher than baseline, and the 70% wrist PT was significantly higher than 30% and 50%. Ear PT of 50% and 70% were significantly higher than the baseline and 30%. The 70% exercise intensity was signifi-cantly higher than the 50% exercise intensity.
Table 3 show that Correlation among EMG mean, Wrist Tremor, Ear Tremor, RPE and kg. EMG mean and wrist tremor, ear tremor, RPE, weight had a correlation. There was a correlation between Wrist Tremor and Ear Tremor, weight, but wrist tremor and RPE non correlation. Ear Tremor and RPE, Weight had a correlation. Also, RPE had a correlation Weight

Correlation among mean EMG, wrist tremor, ear tremor, RPF, and arm curl exercise weight.
Figure 3 shows that the represented images of the acceleration of PT on the wrist and ear for all intensities during resistance exercise increased as intensity increased. Figure 4 displays the frequency spectra of PT on the wrist and ear for all intensities during resistance exercise. All the wrist PT spectra have a peak range between 10 Hz and 18 Hz and the ear PTs have a broad peak between 5 Hz and 15 Hz.
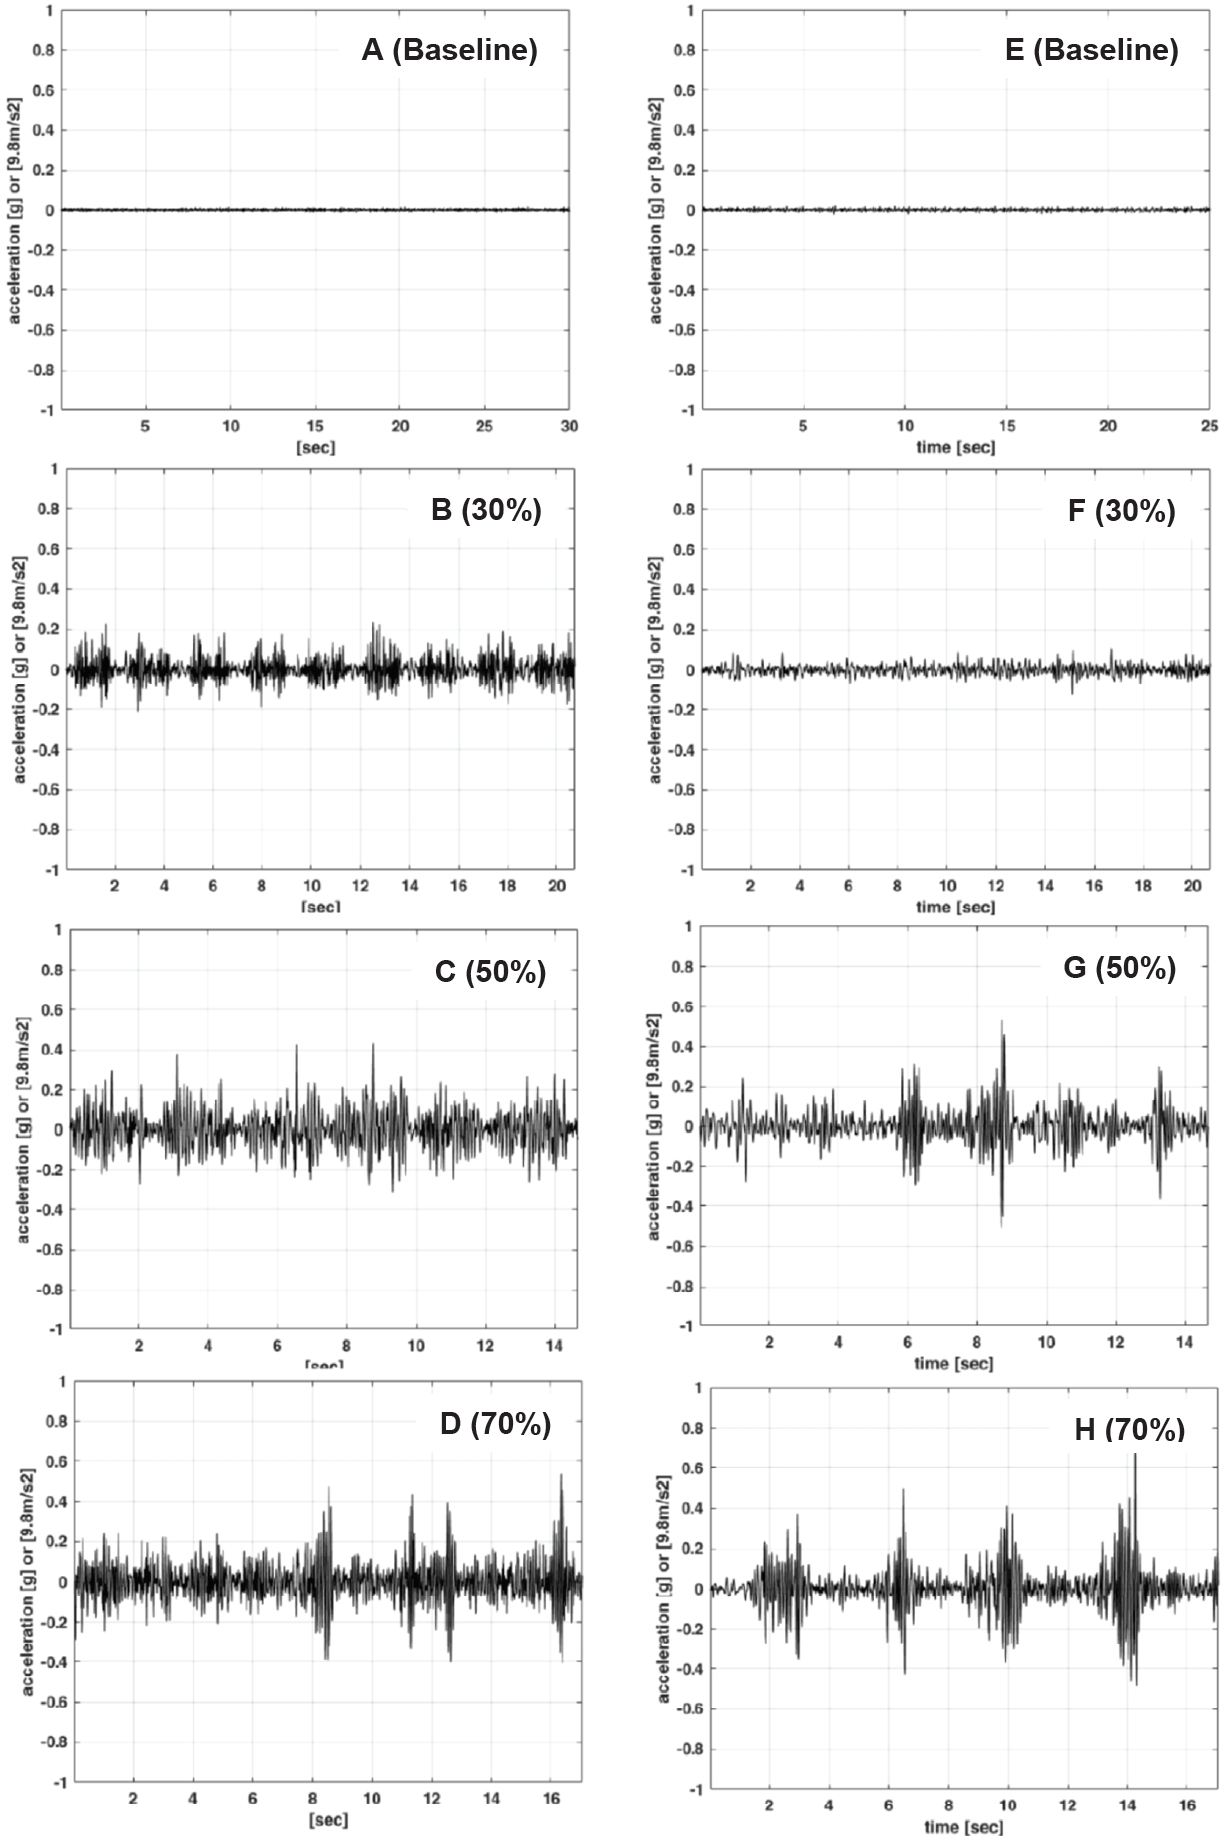
Representative images of acceleration of physiological tremor during arm curl exercise at baseline (A), 30% (B), 50% (C), and 70 % (D) of 1-RM on the wrist and at baseline (E), 30% (F), 50% (G), and 70 % (H) of 1-RM in the ear.

Representative images of the frequency (Hz) of physiological tremors during arm-curl exercise at baseline (A), 30% (B), 50% (C), and 70 % (D) of one-repetition maximum (1-RM) on the wrist and at baseline (E), 30% (F), 50% (G), and 70 % (H) of 1-RM in the ear.
DISCUSSION
This study aimed to determine whether PT could be used to evaluate the intensity of resistance exercise during arm curl exercise. We examined PT responses using wearable three-axis accelerometers on the wrist and ear at different intensities during resistance exercise with matched total work. The results showed that as resistance exercise intensity increased (baseline (0%), 30%, 50%, and 70% of 1-RM) with matched total work, there was a corresponding significant increase in both wrist and ear PT. Furthermore, both PTs were significantly correlated with EMG activity, lactic acid levels, and RPE.
In our study, RPE increased significantly as arm-curl resistance exercise intensity increased. Our results are consistent with those of previous studies. Two previous studies showed that RPE for the whole body and active muscles was significantly higher during resistance exercise at a higher strenuous intensity of 1-RM than at a lower intensity of 1-RM [5,6]. Although the total work rate and rest duration were made equal to minimize the effect of work performed on RPE responses [6], RPE significantly increased as arm-curl exercise intensity increased. This acute localized muscle activation following arm-curl exercise at 30%, 50%, and 70% of 1-RM demonstrated greater sensitivity and discomfort to strenuous exercise intensity. Thus, it is sufficient to elicit a significant change in the psychophysiological magnitude during different resistance exercise intensities. Furthermore, we observed a significantly different increase in lactic acid with muscle activation from low-to high-intensity after resistance exercise. The results of this study are consistent with those of previous studies following differential resistance training intensities [20]. These results clarify that higher lactic acid levels following high resistance exercise intensity stimulate anaerobic metabolism for energy production.
In general, the gold-standard measurement for fatigue is through electromyographic (EMG) signals recorded during muscle exercise [21]. As EMG signals increase with muscular fatigue, muscle groups are activated by the increased exercise intensity [22]. We determined that EMG values during each resistance exercise intensity and EMG activity were comparatively higher under heavier conditions, even when the total work was held constant during each condition. These results are consistent with those of previous studies [23,24]. Increase in muscular activation is directly linked to central motor efferent commands [25]. Moreover, EMG activity evokes afferent signals from the Golgi tendon organs, muscle spindles, and mechanoreceptors [26-28]. Therefore, an increase in EMG may refine the neurophysiological link functions during resistance exercise as the intensity increases. The corollary to this finding is that greater motor units with incremental loads accelerate tremor amplitude, resulting in increased muscle spindle activity and stretch reflex loop [29]. Several studies have reported that large increments in PT are produced by dynamic periods of isotonic contractions and are observed in muscle fatigue [30]. In our results, both wrist and ear PT increased significantly as resistance exercise intensity increased during the arm-curl exercise. Although tremor amplitude produced a statistically significant increase with incremental intensity of arm-curl exercise, the actual changes were small for both the wrist and ear (less than 0.1 RMS).
Tremors can be found at a wide variety of frequencies and amplitudes. However, clinical assessments of tremors are often combined with EMG activity and accelerometry, as the definition is approximate and inaccurate [31]. Correlation analysis between tremors and perceptual and physiological variables may strengthen the relevance of PT. In the present investigation, it was expected that PTs on the wrist and ear would significantly correlate with EMG, RPE, and lactic acid levels during arm-curl exercises with different intensities. As expected, previous studies have shown that RPE was significantly correlated with EMG and lactic acid levels during resistance exercise. The present study may have elicited large changes in PT, EMG, RPE, and lactic acid levels during arm-curl resistance exercise. Therefore, we provided evidence with relevant methods in resistance exercise based on accelerometers compared with spiralometry [32] and laser lines [33], which applied useful methods in clinical tremors. However, further studies are needed to refine the acceptability of PT as a tool for evaluating resistance exercise intensity by examining various types of resistance exercise.
Although PT of the hands and fingers has been well established [34-36], quantification of PT with different exercise intensities is still lacking. PT is driven by two possible mechanisms. The first component is subject to mechanical resonance at the eigenfrequency of the oscillating limb. This mechanical resonance may simultaneously oscillate the limb by recruiting the motor unit, and this rhythm is a feedback system into the spinal reflex loops, which could enhance the tremor [37]. The second component, in the 8-12 Hz range, is driven by the central nervous system (CNS). This central rhythm is the load-invariant spectrum [38]. In our study, the analyses of the frequency domain of PT on the wrist and ear were observed between 10–18 Hz and 5–15 Hz, respectively, reflecting that both neural and mechanical origins generate PT in all intensities. The shape of the spectra for isometric and isotonic exercises with neural input to the muscle was remarkably similar in all trials [38]. In our procedure, there was inevitably a sharp peak in the frequency of movement due to dynamic exercise. However, the frequency domain partially coincided with that reported in previous studies [39]. We postulated that the frequency domain coincides with previous studies, which can be mainly found between 8–12 Hz; however, this hypothesis is partially understood. Thus, inertial load had an influence on load variation during the arm-curl exercise with load added.
This study had several limitations. First, the selected participants comprised mainly of healthy men who did not exercise regularly. More studies with different populations, including females, elderly, and active individuals, are needed to evaluate whether other factors (e.g., sex difference, aging effect, and exercise habit) may influence the different PT responses during resistance exercise with different intensities. In addition, we did not examine PT using accelerometers under various resistance exercise conditions. Therefore, further research is needed to investigate the application of PT under various resistance exercise conditions.
In summary, we found that PT increased when arm curl exercise intensity increased. In addition, all variables, including EMG, RPE, and lactic acid levels, also increased as exercise intensity increased. From a clinical perspective, the duration and intensity of exercise are important factors in training. This study identified changes in PT during resistance exercises with different intensities. In particular, the use of PT analyses during resistance exercise provides a more intuitive delineation of resistance exercise intensity and fatigue. This is the simplest method for quick assessment of resistance exercise intensity using a smartphone accelerometer in a clinical setting. In addition, PT may be applied to sports performance and rehabilitation: (1) as a neuro-feedback tool to improve the performance in archery, shooting, and biathlon (2) as a tool to check the oscillations during resistance and balance training in athletes with sports injuries. Although we demonstrated that PT can be applied to resistance exercises, PT with accelerometers is needed for more accurate and valid information regarding a variety of resistance exercises and sports fields.
Acknowledgements
This research was supported by the College of Education, Korea University Grant, 2022.