Applications of proportional odds ordinal logistic regression models and continuation ratio models in examining the association of physical inactivity with erectile dysfunction among type 2 diabetic patients
Article information
Abstract
[Purpose]
Many studies have observed a high prevalence of erectile dysfunction among individuals performing physical activity in less leisure-time. However, this relationship in patients with type 2 diabetic patients is not well studied. In exposure outcome studies with ordinal outcome variables, investigators often try to make the outcome variable dichotomous and lose information by collapsing categories. Several statistical models have been developed to make full use of all information in ordinal response data, but they have not been widely used in public health research. In this paper, we discuss the application of two statistical models to determine the association of physical inactivity with erectile dysfunction among patients with type 2 diabetes.
[Methods]
A total of 204 married men aged 20-60 years with a diagnosis of type 2 diabetes at the outpatient unit of the Department of Endocrinology at PSG hospitals during the months of May and June 2019 were studied. We examined the association between physical inactivity and erectile dysfunction using proportional odds ordinal logistic regression models and continuation ratio models.
[Results]
The proportional odds model revealed that patients with diabetes who perform leisure time physical activity for over 40 minutes per day have reduced odds of erectile dysfunction (odds ratio=0.38) across the severity categories of erectile dysfunction after adjusting for age and duration of diabetes.
[Conclusion]
The present study suggests that physical inactivity has a negative impact on erectile function. We observed that the simple logistic regression model had only 75% efficiency compared to the proportional odds model used here; hence, more valid estimates were obtained here.
INTRODUCTION
Many times, health status is often measured on an ordinal scale. For example, the extent of the condition of the patient may be measured on a scale of “mild, moderate, or severe” symptoms. There are many challenges when the outcome variable is on an ordinal scale, and often, through numerical scores. Numerical scales consider consecutive points as equivalent, but on an ordinal scale, the differences among the categories are not necessarily equal and often are not even measurable [1]. To avoid this assumption, such data are usually analyzed by creating dichotomies among the levels of response variables and through standard techniques for binary data. However, this approach loses information by collapsing categories of the original scale, unless there is perfect homogeneity within the categories being collapsed [2]. Statistical methods using the ordinal nature of this kind of response data have been developed and have received considerable attention in epidemiological journals. However, their utilization in epidemiological and public health research is minimal.
Many studies have observed that the prevalence of erectile dysfunction is high among those who perform low levels of leisure-time physical activity [3-5]. However, this association among patients with type 2 diabetes is unclear. The aim of this paper is to provide a brief outline of models for analyzing data with ordinal responses and to evaluate their usefulness in identifying the association of physical inactivity with erectile dysfunction among patients with type 2 diabetes.
METHODS
Study population and participants
Married men aged 20-60 years with a diagnosis of type 2 diabetes attending the outpatient unit of the Department of Endocrinology at PSG Hospitals, Coimbatore, during the months of May and June 2019 were enrolled in this study. Erectile dysfunction was assessed using the International Index of Erectile Function (IIEF). A preliminary report on the sociodemographic and clinical correlates of ED among type 2 diabetes has been published [6].
Sample size calculation
With an expected prevalence of erectile dysfunction among type 2 diabetes as 40%, 20% allowable error of the prevalence with 95% confidence limits, and 25% non-response, the required sample size for this study was 204.
Exclusion criteria
Patients with a history of coronary events in the previous four weeks, and patients with liver diseases, renal diseases, and those undergoing dialyses were excluded.
Ethical committee approval
The study was approved by the Institutional Human Ethics Committee, PSG Institute of Medical Sciences and Research, Coimbatore, IRB No: SOP 03-V 4 / ANX 02-V 4.1.
Outcome variable
In this study, only one question from the IIEF was considered the primary outcome variable: How often were you able to get an erection during sexual activity? This was elicited on an ordinal scale (no sexual activity, almost never, few times, sometimes, most times, almost always).
Explanatory variable
Physical activity was assessed based on the minutes per day involving in leisure time physical activity and was measured categorically as less than 40 minutes per day versus more than 40 minutes per day. Leisure time physical activities include sports, exercises and recreational walking.
Data management and statistical analysis
Data were analyzed using IBM SPSS Statistics for Windows (version 24.0) and the SAS system (version 9.1.3).
Cumulative logit model
This commonly used statistical approach allows ordinal responses as outcome variables and involves modelling cumulative logits. The cumulative logit model was originally proposed by Walker and Duncan [7] and later called the proportional odds model [8]. In the proportional odds model with an outcome (D) with G levels (D = 0, 1, 2, ….…, G-1) and one independent variable (X1), the probability that the disease outcome is in a category greater than or equal to g, given the exposure is over 1 plus e to the negative quantity αg plus β1X1.
The probability that the disease outcome is in a category less than g is equal to 1 minus the probability that the disease outcome is greater than or equal to category g.
where, g = 1, 2,…….,G-1
Now,
This clearly indicates that the computation of the odds ratio in the ordinal regression is analogous to the standard logistic regression, except that there is a single odds ratio for all comparisons [9].
Extending the cumulative ordinal logit model for adjusting the covariates
where, g = 1, 2, ……., G-1
Hence,
The odds ratio is then,
The outcome variable in this study was No/Never erection, Few/Sometimes erection, Most/Almost getting erection. The model was fit to the data using IBM SPSS(v24.0) after verifying the proportional odds assumption.
Continuation ratio model
Feinberg proposed an alternative method for analyzing categorical data with ordered responses[10]. When the cumulative probability
Then the continuation ratio model can be formulated as logit
The continuation ratio model is best suited to circumstances in which the individual categories of the response variable are of intrinsic interest[11-13].
The model was fit to the data using the SAS system using the GENMOD procedure[14-16].
Asymptotic efficiency
Asymptotic efficiency is defined as the limit, as the sample size increases, of the ratio of the sample size required for the two methods (i.e., in this study, the simple logistic regression and proportional odds model) in order to achieve the same precision when close to the null hypothesis[1,17]. We examined the theoretical power gain by calculating the asymptotic relative efficiency of the logistic regression analysis using the dichotomous outcome compared with an analysis using the proportional odds model using the method suggested by McCullagh et al[8].
RESULTS
Of the 204 patients, 5(2.5%) did not have any sexual activity, 3(1.5%) never got erection, and 56(27.5%) had only a few erections. The prevalence of erection during sexual intercourse according to various categories is presented in Table 1.
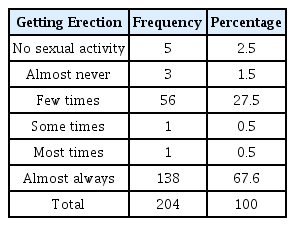
Prevalence of erection during sexual intercourse among type 2 diabetic patients
Of the study population, 120(58.82%) participants were involved in leisure-time physical activity for less than 40 minutes per day (Table 2). Table 2 shows the distribution of erectile dysfunction according to the levels of leisure-time physical activity and other variables. Erectile dysfunction was more common in the participants who engaged in less leisure time physical activity (p<0.05).

Association of leisure time physical inactivity, age and duration of diabetes with erectile dysfunction among type 2 diabetic patients
Since the outcome variable is in the ordinal scale, and to check the proportional odds assumption, a comparison of odds ratios across various categories of exposure were made and are presented in Table 3. The odds ratio for leisure time physical activity greater than 40 minutes per day and less than 40 minutes per day with the outcome variable ‘most/almost getting erection’ compared with ‘no/never/few/sometimes getting erection’ was 0.38 and with the outcome variable ‘few/sometimes/most/almost getting erection’ compared with ‘no/never getting erection’ was 0.46 (Table 3).

Comparison of odds ratios across various categories of exposure using logistic regression analysis
The proportional odds ordinal logistic regression model allowed us to compare multiple outcome categories in order to assess the effect of leisure time physical activity on the severity of erectile dysfunction. We observed that the diabetic patients with leisure time physical activity greater than 40 minutes per day as compared to those with leisure time physical activity less than 40 minutes per day reduced the odds of erectile dysfunction (odds ratio=0.38) across the six severity categories of ‘getting erection during sexual intercourse’ (Table 4). Similarly, in the continuation ratio model, we observed an odds ratio of 0.41 (Table 5).
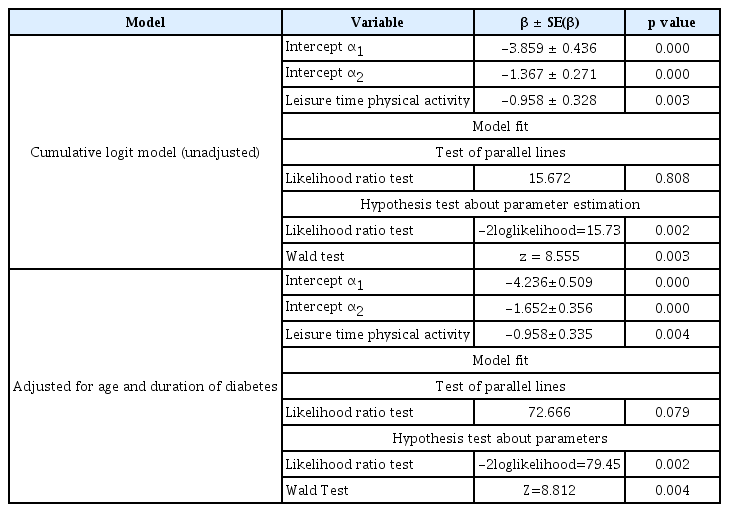
Maximum likelihood estimates and model fitting information in cumulative logit model
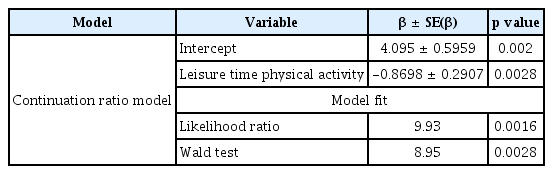
Maximum likelihood estimates and model fitting information in continuation ratio model
However, to use the proportional odds model, we need to meet the proportional odds assumption. In SPSS, the ‘Test of parallel line’ assumption was used and it was observed that the assumption holds good (p=0.808) for the cumulative logit model but the assumption was violated for proportional odds model (p=0.0016). The details of the model fitting are presented in Tables 4 and 5.
We also observed that the simple logistic regression models presented in Table 3 have only a 75% efficiency compared to the proportional odds model presented.
DISCUSSION
Many studies have investigated the association between physical inactivity and erectile dysfunction. However, this association has not been readily studied in patients with type 2 diabetes. Various models for addressing the association when the outcome variable is on an ordinal scale are known, but their application in clinical and public health research is not well utilized.
Association of physical inactivity with erectile dysfunction
This study provides a brief outline of suggested epidemiological models for analyzing data with ordinal responses and their usefulness in identifying the association of physical inactivity with erectile dysfunction among patients with type 2 diabetes. This also supports the hypothesis that physical inactivity has a negative impact on erectile function. Erectile dysfunction is, by definition, the persistent inability of a male to achieve and maintain a penile erection sufficient to perform satisfying sexual intercourse[18]. However, in this study, we used only one component; that is, how often was an erection obtained during sexual intercourse.
Although pharmacological therapy is a first-line treatment modality for erection problems, the role of lifestyle interventions in reducing the burden of erectile disorders is increasingly recognized. In a study by Maresa et al., supervised aerobic exercises and 5 mg tadalafil/day improved erectile dysfunction by 86.11%compared to tadalafil alone [19]. In another study, Dorey et al. observed that supervised activity involving pelvic floor muscle contraction improved ED after a period of six months[20]. In this study, we observed that leisure-time physical activity over 40 minutes per day reduced the burden of erection problems among patients with type 2 diabetes.
The physiological mechanisms underlying this improvement remain unclear. A growing body of evidence suggests that the pelvic floor muscles play a crucial role in penile rigidity. Their efficient contraction prevents the return of venous blood from the penis and increases intracorporeal pressure significantly higher than that of systemic blood pressure.
Model fitting and observations
In addition, this paper also presents a review of generalized linear regression models for analyzing ordered responses. The primary motivation for using an ordinal regression model rather than collapsing the outcome variables into two groups and using conventional logistic regression models is the desire to use all available information and hence gain more power in investigating the effect of risk factors on the outcome variable[1]. The application of the cumulative logit model and continuation ratio models in epidemiological studies involving ordered responses are discussed. It should also be noted that the data obtained from each dichotomy are correlated; hence, the estimation of the common odds ratio and inference concerning for obtaining summary information from independent strata cannot be done using techniques such as Mantel-Haenszel et al. and hence these models must be used. It should also be noted that these two models are not directly comparable since the cumulative logit model predicts cumulative probabilities and continuation ratio models predict conditional probabilities[1].
We observed that diabetic patients with leisure time physical activity greater than 40 minutes per day had reduced odds of erectile dysfunction across the six severity categories of “erection” during sexual intercourse as compared to those performing less than 40 minutes per day of leisure-time physical activity. Large-scale multicentric studies adjusting the effects of various confounding factors, including medication and duration of diabetes, in the association between physical inactivity and erectile dysfunction, can provide more light in this area. Statistical models and programs must be developed accordingly. The present study is a cross-sectional study; hence, the cause-effect relationship cannot be established, which is a major limitation of the study.