


INTRODUCTION
The Korean elderly population aged over 65 is estimated to be 13.1% of the total population in 2015 and will continue to increase, reaching an estimate of 15.7% in 2020 [1]. A recent report predicted that more than 600 million cases of hip fracture will be treated one year worldwide in 2050 due to the extension of the average life span and an increase in the ageing population. 51.1% of these hip fractures will occur in Asians [2]. In Korean seniors over the age of 65 with osteoporosis, elderly men comprised only 3.9%, while elderly women comprised 27.7%. It was reported that the risk factors for osteoporosis were more than seven times higher in elderly women than in elderly men [3]. It was also reported that bone mineral density (BMD) reaches the peak bone mass at the age of 30 and is maintained until menopause. After menopause, bone mass decreases rapidly and most women develop osteoporosis by the age of 70 [4]. Especially, in postmenopausal women, it was reported that cell death in osteoclasts decreased and the cell death of osteoblasts increased due to estrogen deficiency. Therefore, the number of osteoblasts gradually decreases and bone loss occurs due to the imbalance, increasing the risk of osteoporosis [5].
Many previous studies reported that BMD is associated with nutrient intake and exercise. According to Kalsson et al. [6], exercise increases BMD and prevents weak BMD due to ageing. Blanchet et al, [7] also reported that an effective exercise program could prevent or recover bone loss in premenopausal women. In a study on adult females, Lee et al. [8] reported that the frequency and type of exercise had a significant impact on BMD. In addition, according to a study on males over the age of 50, carbohydrate intake in males with osteopenia was significantly higher than in the normal group while calcium intakes were significantly lower than in the normal group [9]. In a study of the correlation between sodium intake and BMD, it was found that higher sodium intake led to lower BMD [10]. It was also reported that dietary factors such as magnesium and zinc deficiencies as well as overconsumption of animal protein, salt, alcohol and caffeine reduced BMD [11]. Although there were a few studies on the relationship between BMD and nutrient intake as well as BMD and physical fitness there are insufficient studies on the compositional correlations among the three factors, nutrient intake, BMD and basal physical fitness, in elderly women. Kristinsson [12] reported positive correlations among BMD on the upper arm, calcium intake and grip strength in girls aged 13 to 15, while Yuko et al. [13] reported a significant correlation among physical activity, nutrition and BMD in young Japanese women. These studies did not identify the exact correlation between BMD and physical fitness because they used partial BMD data rather than Total-BMD and did not include information about the subjectsŌĆÖ physical fitness levels. Especially, there are no studies on the correlations among nutrient intake, physical fitness and blood factors to examine the characteristics of bone loss in elderly women.
Therefore, whole body BMD of elderly women was measured in this study to classify the subjects into a normal group and an osteopenia group. The nutrient intake, physical fitness and serum markers were then compared to analyze the characteristics of osteopenia in the elderly women.
METHODS
Subjects
The subjects in the study were 54 elderly women aged between 60 and 77 who had taken no drugs that might affect their BMD due to a chronic disease or hormone therapy in the last six months. Groups were classified according to the BMD (T-score). The criteria for the grouping were as follows: the osteopenia group (OG; n = 29) was selected based on T-score values less than ŌłÆ1 as classified by WHO while the normal group (NG; n = 25) had T-score values above ŌłÆ1.
Body composition
After measuring the height and weight, the body fat, fat free mass and muscle mass of all subjects were measured using the fat analyzer X-Scan Plus II (Jawon Medical, Korea).
Basal physical fitness
Items measured to determine basal physical fitness included muscle strength, muscle endurance, flexibility, agility and balance as defined in the senior fitness test (SFT) [15]. To test upper body muscle strength, the grip strength and arm curl tests were used while the chair stand test was employed to test lower body muscle strength. For a test of muscle endurance, a 2 min. walk was used. In addition, the chair sit & reach and the back scratch tests were employed to test flexibility. To test agility and dynamic balance, the 2.44m up & go test was used and the one leg stand test was used to test static balance.
Measuring BMD
BMD and BMC for the entire body were measured by Dual Energy X-ray Absorptionmetry (DEXA) using a BMD analyzer (DPXL; Lunar, USA). Analysis was then performed on the arms, legs, trunk, ribs, pelvis, spine and body BMD.
Survey of nutrient intake
The dietary intakes of the subjects in this study were assessed by experienced researchers using a 24-hour dietary recall method. Dietary intakes for two days in non-consecutive weekdays and one day in a weekend were recorded. To minimize the error in the estimation of dietary intakes, the survey was conducted using a two-dimensional (2D) model source book and three-dimensional (3D) survey assistance tools such as a measuring cup and measuring spoon. Nutrient intakes were calculated by CAN Pro3.0 (Korean Nutrition Society, 2010).
Analysis of serum markers
All subjects were asked to maintain an empty stomach for 8 hours and to refrain from any exercise for 24 hours before blood collection. 5 ml of blood was collected from the antecubital vein by an expert using a disposable syringe. The collected blood was left at room temperature for 30 minutes then centrifuged at 3,500 rpm for 15 minutes to separate the serum. Serum Ca, Mg and Pi were analyzed by a specialized blood analysis company (SQLab, Seoul).
Statistical analysis
Data processing was performed by calculating the average and standard deviation in the measurements for each group using SPSS 19.0. An independent t-test was conducted to analyze the difference between the NG and the OG. The relationship among variables was analyzed using PearsonŌĆÖs correlation. A simple regression analysis was performed to confirm the effect of nutrient intake and physical fitness on BMD. The statistically significant level for each variable was p < 0.05.
RESULTS
Comparisons of BMD and basal physical fitness, serum markers and nutrient intakes
BMD, blood index, physical fitness and nutrient intakes were compared in the two groups as shown in <Table 1>. The average age was significantly higher in the OG than in the NG (p < .01), and there were no significant differences between the groups in weight and body composition (N.S.). BMD in all regions, including the arms, legs, trunk, ribs, pelvis, spine and total body was significantly lower in the OG, and BMC in all regions was also significantly lower in the OG compared with the NG (p < .001). T-score was significantly lower in the OG (p < .001). There were no differences in serum Ca and Mg between the groups, but Pi level was significantly lower in the OG than in the NG (p < .05). For the basal physical fitness including muscle strength, muscle endurance, flexibility, agility and balance, there were no significant differences between the NG and the OG (N.S.). In addition, there were no statistically significant differences in both calorie nutrient intake and micronutrient intake between the NG and the OG (N.S.).
Relationship between BMD and each variable
The correlation of BMD with each variable in each region for all 54 subjects is shown in <Table 2>. It was found that weight had significant correlations with total-BMD and T-score (p < .01), and fat free mass also had a significant correlation with total-BMD (p < .01). It was found that serum Pi had significant correlations with BMD in all regions and also with the T-score (p < .05, p < .01).
Regression analysis of BMD and each variable
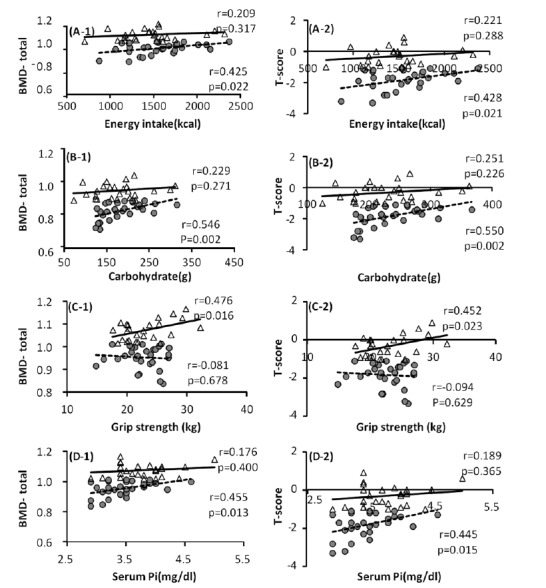
To examine the differences in the variables affecting the BMD in each group, single regression analyses of variables such as BMD, T-score, nutrient intake and basal physical fitness were conducted (Fig. 1). The results showed that energy intake had no correlations with total-BMD and T-score in the NG, but there were significant correlations in the OG (p = 0.022, p = 0.051; Fig. 1 (A-1), (A-2)). Calorie nutrient and carbohydrate had no significant correlations with total-BMD and T-score in the NG, but there were significant positive correlations in the OG (p = 0.002; Fig. 1 (B-1), (B-2)). Grip strength had significant positive correlations with total-BMD and T-score in the NG, while there were no correlations found in the OG (p = 0.016, p = 0.023; fig 1. (C-1), (C-2)). There was no significant correlation between serum markers and BMD in the NG, but there were positive correlations of Pi with total-BMD and T-score in the OG (p = 0.013; fig 1. (D-1), (D-2)).
DISCUSSION
This study classified 54 elderly women over 60 years old into the NG and the OG according to their BMD and the correlations of BMD with nutrient intake, basal physical fitness and serum markers were analyzed. The BMI of the NG was 25.39 ┬▒ 2.80 while that of OG was 24.43 ┬▒ 2.73 (kg/m2), both leaning toward mild obesity. There were no significant differences between the groups. The BMI was based on range proposed by the Korean Society for the Study of Obesity [16], which classifies BMI less than 18.5 as low body weight, 18.5-22.9 as normal, more than 23 as overweight, 25-30 as Stage 1 obesity (mild obesity), 30-35 as Stage 2 obesity (moderate obesity), and more than 35 as extreme obesity. In addition, there were significant correlations of weight with total-BMD and T-score (p < .01), and fat free mass had a significant correlation with total-BMD (p < .01). From these results, it was determined that elderly women with high weight maintain high BMDs and that especially, maintaining high fat free mass such as muscles is an important weight factor. This fact has long been asserted by researchers such as Lindsay et al. [17], who reported that weight itself provides the skeletal muscle with mechanical stimulation and the repetitive contraction of the skeletal muscle triggers osteogenesis. In recent studies, Lee [18] reported that women with high fat free mass also had high BMD, particularly emphasizing the importance of increased muscle mass. A correlation between BMD and body fat percentage was reported in some studies [19]. It was reported that the more obese postmenopausal women became, the higher their BMD [20]. However, it is assumed that this is because the generation of adrenal estrogen in adipose tissue has a positive impact on BMD and is not necessarily due to the weight [21]. To sum the results, it was found that the higher the weight, the more positive the effect on BMD, and an increase in weight resulting from an increase in fat free mass had a more positive impact on BMD than an increase in body fat percentage in obese individuals.
On the other hand, analysis of nutrient intakes showed that there were no statistically significant differences in calorie nutrient and micronutrient intake between the groups. The rates of carbohydrate, protein and lipid intakes were 70%, 18% and 11%, respectively, in both the NG and the OG. When these were compared with the proper rates for energy according to the 2010 KDRIs (carbohydrate, 55~70%; protein, 7~20%; and lipid, 15~25%) [22], carbohydrate intake rate was high and lipid intake rate was low. The NG had approximately 92% and the OG had 97% of the average energy intake requirement for the same age, 1,600kcal, which were slightly low. In the result of an analysis of the correlation between calorie nutrient intake and BMD for all subjects, no statistical significance was observed. However, after separating the subjects into two groups, it was found that energy intake and carbohydrate intake had significant correlations with Total-BMD only in the OG. Similarly, a study conducted by Song and Baik [23], which analyzed BMD and nutrient intake in female college students, reported that the BMD of the femoral neck and carbohydrate intake showed a significant positive correlation. In the study by Sung et al., [24] which analyzed the correlations of nutrient and food intakes with BMD, there was no significant correlation found in premenopausal women, but postmenopausal women showed positive correlations of energy and carbohydrate with lumbar BMD. This indicates that sufficient caloric intake is important to maintain bone mass especially in elderly women.
Analysis of the correlation between basal physical fitness and BMD revealed that muscle strength index and grip strength showed no significant differences in the two groups, but there was a significant positive correlation between total-BMD and T-score in the NG. This means that better muscle strength in healthy elderly women has a more positive impact on BMD. Colleran et al. [25] reported that individuals with high muscle strength have faster blood flow due to more muscle action compared to individuals with low muscle strength. This increased blood flow in the skeleton also results in increased bone formation and has a positive impact on BMD [25]. According to several previous studies, elderly women over the age of 65 suffer from rapid physical changes after menopause and osteoporosis subsequently develops with musculoskeletal disorders [26,27]. Muscle mass decreases by about 25% from the age of 50 to about 75 compared to the amount of muscle at the age of 20 and physical abilities such as balance and flexibility noticeably decrease [28,29]. Due to this deterioration of physical functions, the risk of falling increases and falls increase the risk of fracture [30,31], causing a vicious cycle in which hypoactivity causes amyotrophia [32]. It has been reported in many studies that there is a positive correlation between BMD and exercise. Especially, muscle strength exercise has a significant impact on BMD and muscle contraction exercise is evaluated as the most effective exercise for maintaining bone mass [33]. In addition, there may be other types of exercise that are more effective for maintaining bone mass. It seems that further studies of the impact of exercise on BMD are needed.
The results of this study showed that there was no significant difference in dietary Pi between the two groups, but Serum Pi in the OG was significantly lower than in the NG (p < .05). Analysis of the correlation between Serum Pi and BMD in all subjects revealed positive correlations with all BMD indicators (p < .05, p < .01). These are the main findings of the study. In other words, although there was no difference in dietary Pi in elderly women, lower Serum Pi was found to induce lower BMD. Especially, there was no correlation of Serum Pi with total-BMD and T-score in the NG, but there was a positive correlation in the OG (p = 0.013). This suggests that the group with low BMD is more sensitive to the concentration of Serum Pi. If P resorption is not smooth due to a malfunction of the renal tubule, phosphorus is mostly excreted through urine, which reduces the concentration of Serum Pi and leads to rickets. This is called hypophosphatemic rickets [34]. The concentration of serum Ca is almost normal at this stage, but the absorption of Ca is hindered in the intestinal canal. This reportedly causes rickets in children and osteomalacia in adults. In their study analyzing the correlation between Pi intake and Parathyroid Hormone (PTH) in humans, Domingues et al. [35] found that the concentration of serum Pi is maintained by the absorption of P in the small intestine and the release of Pi into urine, both primarily controlled by PTH. In addition, they found that PTH controls the resorption of Pi in the renal tubule, which causes hypophosphatemia. From these results, it was determined that osteopenia in elderly women may be caused by lower resorption of Pi in the renal tubule or by hypophosphatemia due to an increase in PTH caused by hyperparathyroidism.
On the other hand, there are ongoing debates over the correlation between Pi and BMD. There is a report that an increase in Serum Pi promotes the secretion of PTH, which stimulates osteoclast production and consequently increases bone resorption [36]. Some studies also insist on a negative correlation between BMD and Pi [37]. However, it was reported that an increase in Pi in the body decreases urinary Ca excretion by promoting the resorption of Ca in the renal tubule [38]. Research results showing a positive correlation between Serum Pi and BMD are prevalent [39,40]. In this study, a positive correlation between Serum Pi and BMD was found only in the OG, which suggests that BMD control in the OG may be due to a more sensitive reaction to the concentration of Serum Pi [41], i.e., elderly individuals with low BMD should be more cautious to maintain Serum Pi.
In conclusion, the correlations of BMD with nutrient intake, basal physical fitness and serum markers were analyzed by dividing elderly women into a NG and an OG. The results suggested that the maintenance of fat free mass in elderly women plays an important role in maintaining BMD and that sufficient caloric intake could improve BMD in elderly women with low BMD. In addition, the results hinted at the possibility of a decrease in bone mass in elderly women by hypophosphatemia, therefore, maintaining the Serum Pi level is also important.