


INTRODUCTION
The prevalence of cardiovascular disease highlights the necessity of developing effective treatments to improve heart function [1,2]. Aerobic exercise leads to marked structural and mechanical cardiac adaptations that result in improvements in the overall cardiac function. Structurally, aerobic exercise has been shown to result in increased ventricular volume and proportional thickening of the muscular walls [3-5] and greater left ventricular mass in rats [6]. Mechanically, aerobic exercise results in increased shortening velocity [7,8] and calcium sensitivity [9-11] in isolated rat heart muscles. Boldt et al. [12] demonstrated that after 12 weeks of aerobic treadmill running, trained rats had significantly greater left ventricular volume and wall thickness, and isolated skinned cardiac fiber bundles had greater maximal shortening velocities and increased calcium sensitivity than that of sedentary controls. Therefore, exercise is thought to be an effective means of improving cardiac function by stimulating both structural and mechanical adaptations.
In skeletal muscles, whey protein supplementation has been shown to enhance anabolic adaptations in response to resistance exercise [13,14]. This has been shown to be due to greater rates of muscle protein synthesis (MPS) in response to protein ingestion following exercise compared to that of exercise alone [15]. Whey protein, in comparison with other protein sources, is a potent stimulator of MPS as it is a complete protein that is quickly digested and is high in branched-chain amino acids such as leucine [15]. With aerobic training, chronic post-exercise protein supplementation has been shown to enhance adaptations in VO2max [16] by increasing blood volume [17], skeletal muscle mitochondrial biogenesis [18], and skeletal muscle regeneration through increased MPS [19]. The rate of muscle protein turnover, which is a combination of muscle protein breakdown and synthesis, is 83% greater in rat cardiac muscle than that in type I (soleus) and type II (gastrocnemius) muscle fibers [20]. Therefore, the cardiac muscle may be a receptive target for protein supplement intervention. Protein supply has also been shown to result in acute increases in MPS in isolated cardiac preparations [21]. Morgan et al. [22] used a Langendorff isolated rat heart preparation and measured a 40% increase in MPS following the infusion of serum with high amino acid concentrations compared to that of baseline. Similarly, Garlick and Grant [23] administered rat serum amino acid injections and observed an increase in cardiac MPS in vivo. Given the evidence for the ergogenic effects of whey protein on skeletal muscle following resistance and aerobic exercise [19,24-26] and the observed effects on cardiac MPS [22,23], ingestion of a high-protein diet may also have an ergogenic effect on cardiac muscle and its adaptation to aerobic exercise. Therefore, this study aimed to determine the effects of a high-whey-protein diet on cardiac structural and mechanical properties and cardiac function in response to aerobic training. We hypothesized that whey supplementation enhances the structural and mechanical adaptation of the heart in response to chronic aerobic exercise.
METHODS
Exercise and dietary intervention
Twelve-week-old male Sprague-Dawley rats were randomly assigned to four groups: (i) aerobic exercise with a standard diet (Ex+Standard, n = 6), (ii) aerobic exercise with a high-protein diet (Ex+Pro, n = 5), (iii) sedentary with a standard diet (Sed+Standard, n = 6), and (iv) sedentary with a high-protein diet (Sed+Pro, n = 5). One animal from each of the Sed+Pro and Standard+Pro groups died during the intervention and were excluded. The standard diet (AIN93-M) consisted of 13% protein, derived entirely from casein. The protein diet contained whey protein that was incorporated directly into the diet by the manufacturer. It had the same composition as the standard diet, except for an additional 13% protein from the whey concentrate (substituted by mass for corn starch) (5Whey, TestDiet, St. Louis, MO, USA), thereby doubling the dietary protein of the conventional standard diet (Table 1). Rats in the exercise groups participated in a progressive treadmill program [12,27], which consisted of 60 min of a progressive treadmill running program 5 days/week up to a speed of 25 m/min. The sedentary group was placed on a treadmill (Columbus Instruments Exer-3R treadmill, Columbus, OH, USA) and walked for 15 min at 10 m/min once/week. All training sessions lasted 12 weeks. The animals were housed individually at 21°C on a 12:12 light-dark cycle and had access to food and water ad libitum. The study protocol (AC16-130) was approved by the University of Calgary Animal Care Committee and conformed to the guidelines for the Care and Use of Laboratory Animals.
Fitness indices
At the end of the 12-week intervention, aerobic fitness was determined for all rats by measuring the time to exhaustion using a graded treadmill test [27,28]. Each animal began walking on a treadmill at 12 m/min. The speed was increased by 1 m/min every 2 min for the first 16 min and then by 2 m/min every 3 min until failure. A shocker located on the back of the treadmill delivered mild electrical stimulation when the animals touched it. Exhaustion was defined when the animal touched the shocker five times within 1 min, or remained on the shocker [28]. Body mass was recorded weekly, and body fat composition was measured at the end of 12 weeks using dual-energy X-ray absorptiometry.
Cardiac structural and functional adaptations
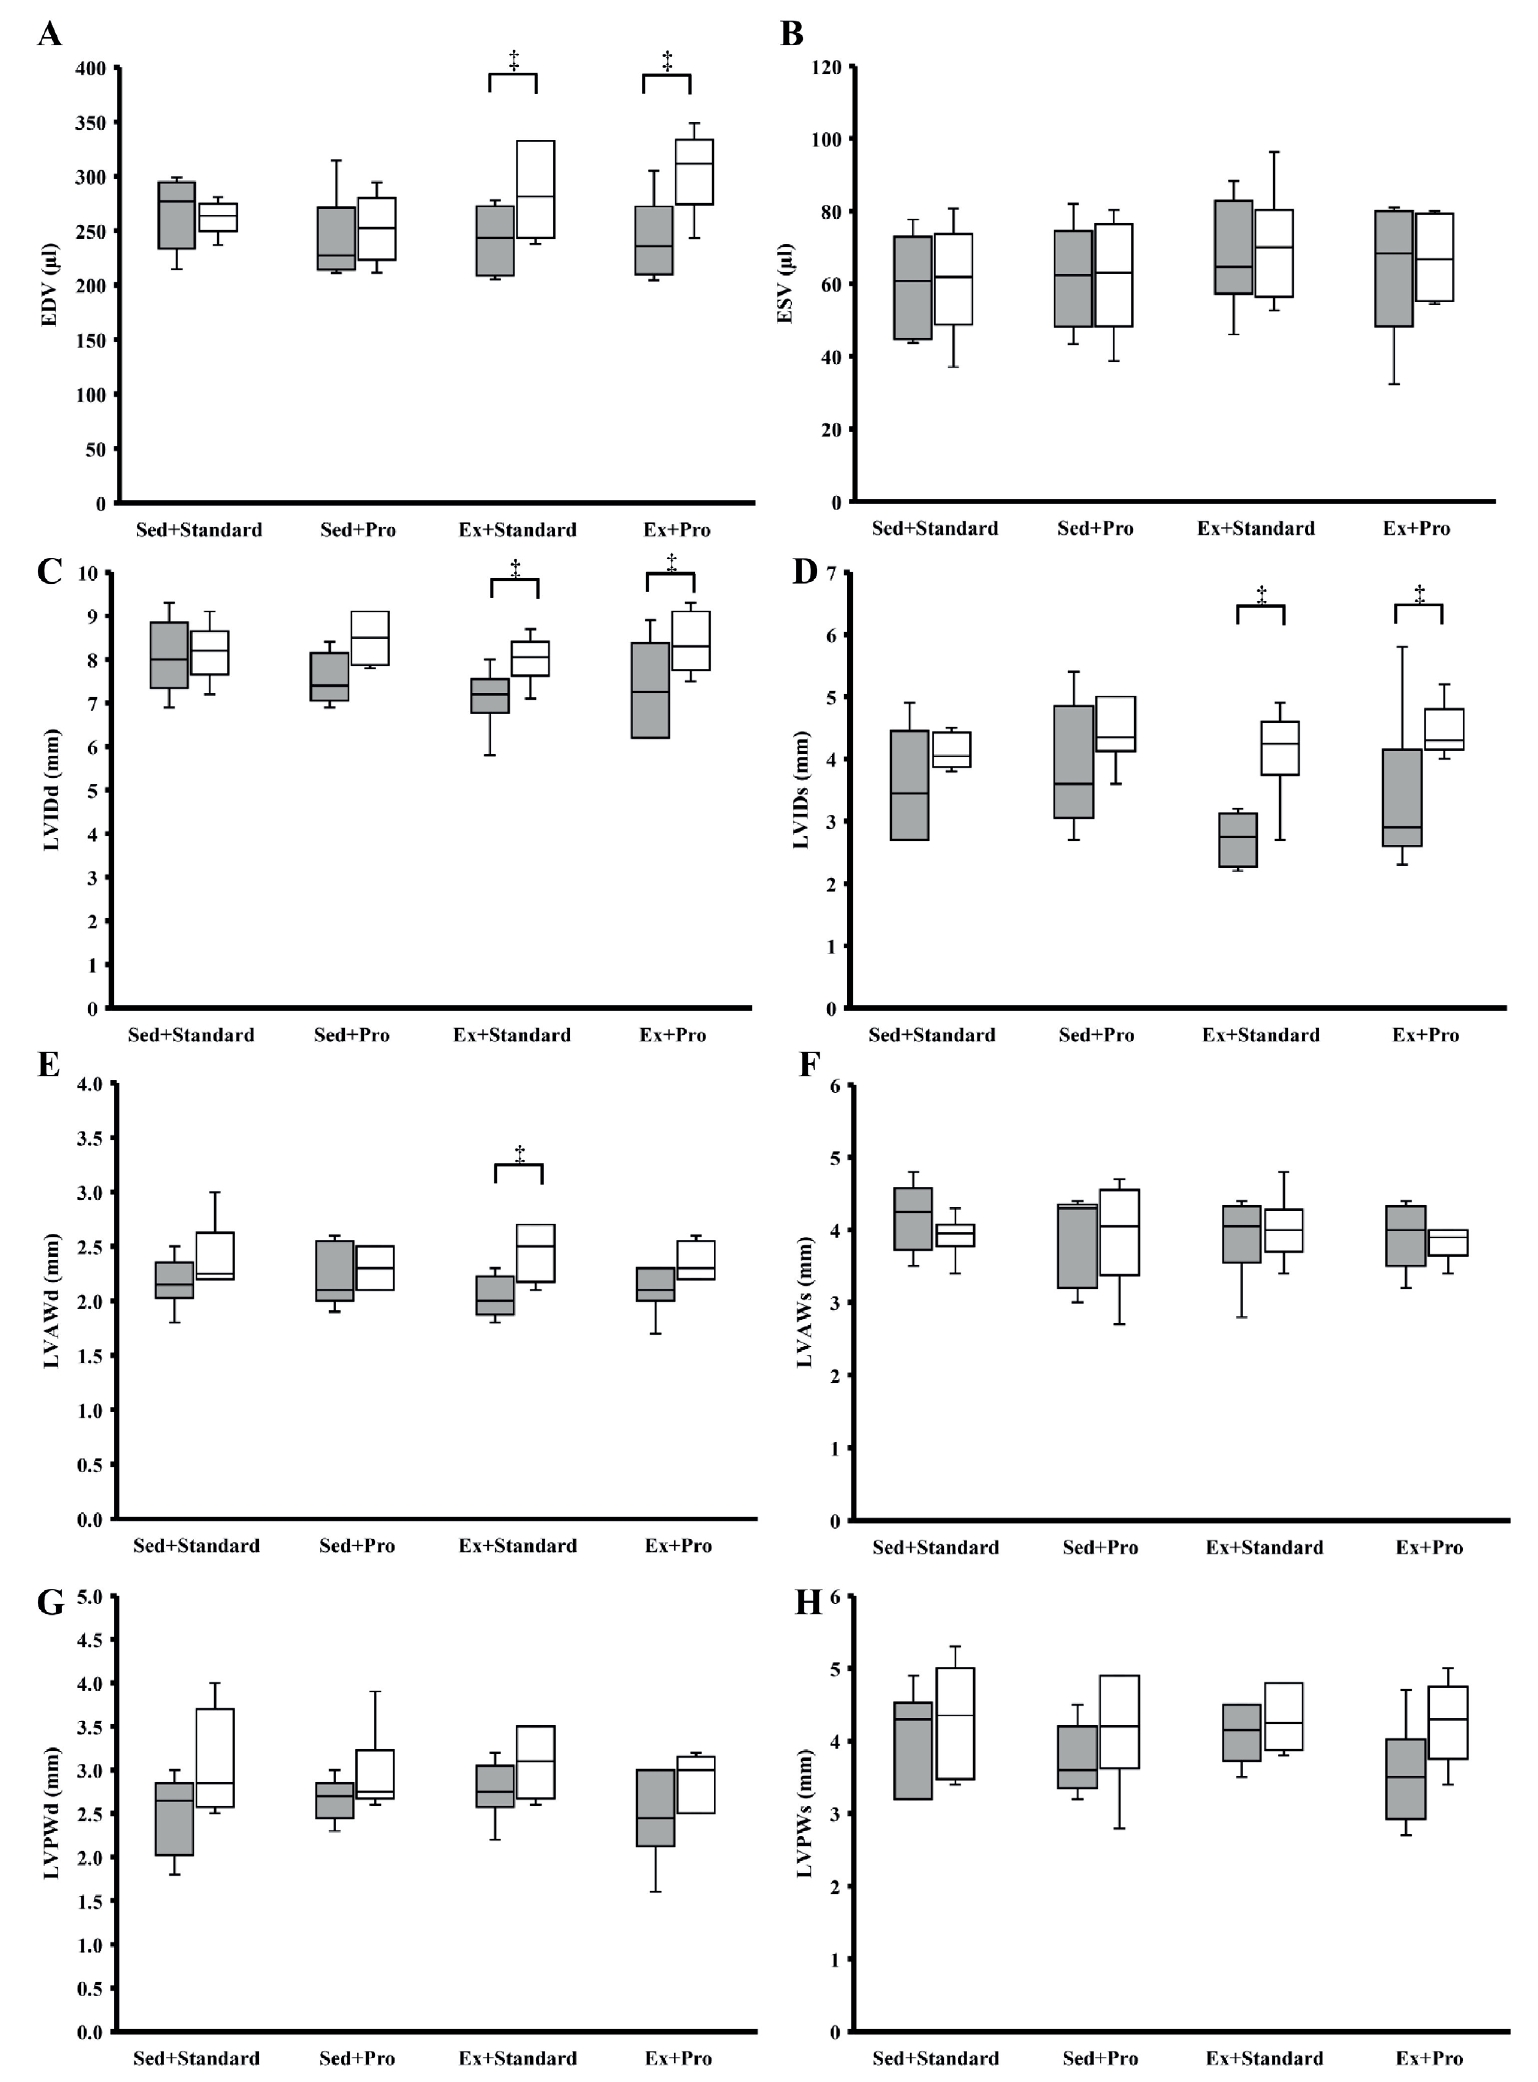
Echocardiographic evaluation was performed using an Esaote MyLab™30Gold Cardiovascular Ultrasound System (Canadian Veterinary Imaging, Georgetown, Ontario, Canada). Rats were anesthetized with isoflurane and placed in the dorsal decubitus position, and the ventral thoracic area was shaved. Two-dimensional images were obtained from orthogonal long-axis four- and two-chamber views [29]. The end-diastolic volume (EDV), end-systolic volume (ESV), and ejection fraction were calculated from three consecutive cardiac cycles by tracing the endocardial border of the left ventricle (LV) in end-diastole and end-systole using the Simpson biplane method [29]. The LV internal diameter (LVID) and anterior and posterior wall thicknesses (LVAW and LVPW, respectively) were determined using M-mode imaging during systole (LVIDs, LVAWs, LVPWs) and diastole (LVIDd, LVAWd, LVPWd) [29]. LV mass was determined according to Watson et al. (2004). Measurements were performed at baseline and after 12 weeks of training.
Tissue isolation
Rats were anesthetized with isoflurane, the chest cavities were opened, and the aorta and vena cava were severed. The hearts were immediately flushed with rigor solution, the external vessels were dissected away, and the heart mass was recorded. The LV was cut open and 3-4 thin strips of trabeculae were sliced along the LV wall and placed in a rigor solution on ice. Following 2 h in rigor solution, the samples were transferred to a 50/50 rigor/glycerol solution and left overnight at 4°C. The following morning, the muscle strips were transferred to a fresh 50/50 rigor/glycerol solution and chemically skinned at −20°C for 3 weeks before mechanical testing. All samples were tested between 3 and 4 weeks postharvest. An additional strip of trabeculae was dissected, immediately flash frozen in liquid nitrogen, and stored at −80°C for biochemical analysis.
Preparation for mechanical testing
All mechanical tests were performed in accordance with previous work (Boldt et al., 2020a, 2021). Once skinned, a strip of muscle was removed and placed in a relaxing solution, where fiber bundles of approximately 100-250 μm in width and 1000-2000 μm in length were isolated manually under a Nikon SMZ1500 (Nikon, Melville, NY, USA) microscope. Each end of the sample was pierced and glued with cellulose acetate to hooks suspended between a length controller (Aurora Scientific Inc., Model 308, Ontario, Canada) and a force transducer (Aurora Scientific Inc., Model 400A, Ontario, Canada), thereby allowing for the simultaneous control of myocyte length and measurement of force. All experiments were performed at ~15°C. The sample length was coarsely adjusted from slack until tension first developed, and a He-Ne laser beam was then used to finely adjust the average sarcomere length to a resting length of 2.2 μm. Following a 3-min rest period to allow for any stress relaxation, the length and width of the sample and the passive (resting) force were recorded. The cross-sectional area of the sample was calculated from its diameter, assuming that the samples were cylindrical in shape. Two skinned samples from each heart were tested, and data were pooled for statistical analysis.
Maximal active stress
The maximal active isometric force, normalized to the cross-sectional area to obtain stress, was determined using a maximal activating solution (pCa = −log[Ca2+] = 4.2). Once the peak stress was reached, the sample was returned to the relaxation solution for deactivation. Maximal active stress was calculated as the difference between the total (measured) stress and resting passive stress immediately preceding the contraction.
Passive stress
Samples were stretched passively from a resting average sarcomere length of 2.2 μm to 2.42 μm (10% of the sample’s total resting length) at a rate of 5% fiber length/s. Once the sample had been stretched to 2.42 μm, the length was held constant for 20 s to allow for stress relaxation before being returned to the initial length (2.2 μm). The peak passive force was taken as the maximum value at the end of the stretch, whereas the steady-state passive force was determined as the mean value of the last second after the stress relaxation was complete. Peak and steady-state passive forces were also measured at an average sarcomere length of 2.53 μm (15% stretch from the initial fiber length) at the same rate of stretch, normalizing forces to each sample’s cross-sectional area to obtain stress. Following the passive stretches, the samples were reactivated maximally to ensure that they did not sustain damage. If the maximum active stress decreased by more than 15% from the initial contraction before stretching, the data from that fiber were excluded.
Unloaded shortening velocity
The maximal unloaded shortening velocity was determined at an initial sarcomere length of 2.2 μm using the slack test [31]. The samples were maximally activated and rapidly shortened (in 2 ms) by 10% (ΔL) of the sample’s length. Thus, the samples became slack and the measured force dropped to zero. The time from the onset of rapid shortening until the force was redeveloped (Δt) was measured. The samples were then re-lengthened, relaxed, and allowed to rest for 3 min. This rapid shortening test was repeated for ΔL values of 11%, 12%, and 13% of the sample’s length. The slope of the linear relationship between ΔL and Δt is used to determine the unloaded (maximal) shortening velocity.
Calcium sensitivity
The sensitivity of the muscle to calcium was determined by establishing a force-pCa curve between pCa 7.0-4.2 [32]. The baseline resting force was measured before transferring the sample to the first solution (pCa 7.0). Once the force stabilized, the sample was moved to the next solution, which contained a higher calcium concentration (pCa 6.8). The samples were exposed to solutions of continuously increasing calcium concentrations of pCa 6.6, 6.4, 6.2, 6.0, 5.8, and 5.4, until reaching pCa 4.2 (maximal activating solution). The relative force at each calcium concentration was calculated by dividing the difference between the maximum force at each concentration and the baseline force by the difference between the maximum force produced at pCa 4.2 and the baseline force. The force-pCa relationship was calculated by approximating the data using least-squares regression for the Hill equation in SigmaPlot 13. Calcium sensitivity was defined and quantitatively compared between samples by determining the pCa value that yielded half of the maximal tension (pCa50) and the corresponding slope of the force-pCa relationship: crossbridge cooperativity (nH).
Myosin heavy chain composition
Myosin heavy chain (MHC) composition was determined using SDS-PAGE gel electrophoresis on 4.5% and 7.5% acrylamide stacking and separating gels, respectively. Myofibrillar protein was extracted from muscle powder and mixed with solubilization buffer (62.5 mM Tris HCl, 10% glycerol, 2% SDS, 5% β-mercaptoethanol, 0.02% bromophenol blue, pH 6.8) to a final concentration of 2.2 mg/1 μL. The samples were boiled for 3 min and immediately centrifuged at 5000 RPM for 15 min at 4°C. The solubilized samples were loaded (0.5 μL/well) into 0.75-mmthick acrylamide gels, and the gels were run in a Bio-Rad Mini-Protean® III unit at 4°C for 10 h at a constant voltage of 72 V and 25 h at a constant current of 1 mA/gel. Following electrophoresis, the gels were stained with Coomassie blue for 60 min and then destained with a 50% ethanol, 7% acetic acid solution for 5 min and a 5% ethanol, 7% acetic acid solution for at least 60 min. After destaining, the gels were scanned using a Bio-Rad scanner and analyzed with ImageJ for optical density (OD) to determine the relative composition of MHCs, α-MHC, and β-MHC. Results were expressed as the composition of α-MHC relative to total MHC (i.e., OD of α-MHC/[OD of α-MHC + OD of β-MHC]).
Solutions
The relaxing solution contained the following (in mmol/L): 170 potassium propionate, 2.5 magnesium acetate, 20 MOPS (3-[N-morpholino]propane sulfonic acid), 5 K2EGTA, 2.5 adenosine triphosphate (ATP), and 14.5 creatine phosphate, at pH 7.0. The activating solution contained the following (in mmol/L): 170 potassium propionate, 2.5 magnesium acetate, 10 MOPS, 2.5 ATP, and CaEGTA and K2EGTA mixed at different proportions to obtain a pCa of 4.2, at pH 7.0. The washing solution contained the following (in mmol/L): 185 potassium propionate, 2.5 magnesium acetate, 10 MOPS, and 2.5 ATP, at pH 7.0. All solutions contained one tablet of protease inhibitors (Complete; Roche Diagnostics, Quebec, Canada) per 100 mL of solution.
Analysis
Statistical significance was determined for cardiac structure and function using Wilcoxon rank-sum tests to examine the differences between the baseline and end point measures. The Kruskal-Wallis test was also used to test for differences between groups cross-sectionally for body composition, fitness measures, and mechanical tests, with pairwise comparisons to assess differences between groups when specified. Statistical testing was performed using IBM SPSS version 24, and statistical significance was set at p < 0.05.
RESULTS
Fitness indices
After 12 weeks of intervention, animals in the exercise groups (Ex+Standard and Ex+Pro) had significantly lower body mass than that in sedentary animals (Sed+Standard and Sed+Pro) regardless of diet (p = 0.007-0.012), but there were no differences between groups for body fat percentage (p = 0.910) (Table 2).
Animals from the Ex+Standard and Ex+Pro groups had significantly longer exhaustion times on the graded treadmill test than that in the Sed+Standard (p = 0.013 and p = 0.002, respectively) and Sed+Pro groups (p = 0.010 and p = 0.002, respectively) (Figure 1). There were no differences in the time to exhaustion between the two sedentary groups (p = 0.852) or between the two groups (p = 0.456).
Cardiac structural and functional adaptations
There were no statistical differences between the groups in terms of absolute heart mass (p = 0.757) and heart mass normalized to tibial length (p = 0.108) (Table 2). When normalized to body mass, hearts from the Ex+Standard and Ex-+Pro groups were significantly greater than those from the Sed+Standard (p = 0.043 and p = 0.009, respectively) and Sed+Pro groups (p = 0.046 and p = 0.010, respectively), but were not different between the animals of the two exercise groups (p = 0.500).
There were no differences between the groups in any structural variables measured by echocardiography at baseline or at the end of the exercise intervention period (Figure 2). Compared with that of baseline, there were no significant changes in ESV (p = 0.498-0.753), LVAWs (p = 0.140-0.893), LVPWd (p = 0.068-0.336), or LVPWs (p = 0.344-0.686) for any of the groups. EDV increased by 29% in animals from the Ex+Pro group (p = 0.043) and 19% in animals from the Ex+Standard group (p = 0.028) but remained the same for the Sed+Standard (p = 0.463) and Sed+Pro (p = 0.344) groups. LVIDd significantly increased in Ex+Pro (p = 0.043) and Ex+Standard (p = 0.046) groups, tended to be higher (p = 0.068) in the Sed+Pro group, but did not change in the Sed+Standard group (p = 0.752). LVIDs increased in the Ex+Standard (p = 0.026) and Ex+-Pro (p = 0.042) groups but were not different in the Sed+-Standard or Sed+Pro groups (p = 0.173, p = 0.078). LVAWd was unchanged in the Sed+Standard (p = 0.136), Sed+Pro (p = 0.593), and Ex+Pro (p = 0.197) groups, but increased in the Ex+Standard group (p = 0.044). LV mass significantly increased from baseline to end point in the Sed+Pro (p = 0.043), Ex+Standard (p = 0.028), and Ex+Pro (p = 0.043) groups, but remained unchanged in the Sed+Standard group (p = 0.249).
Mechanical testing
Active and passive stress
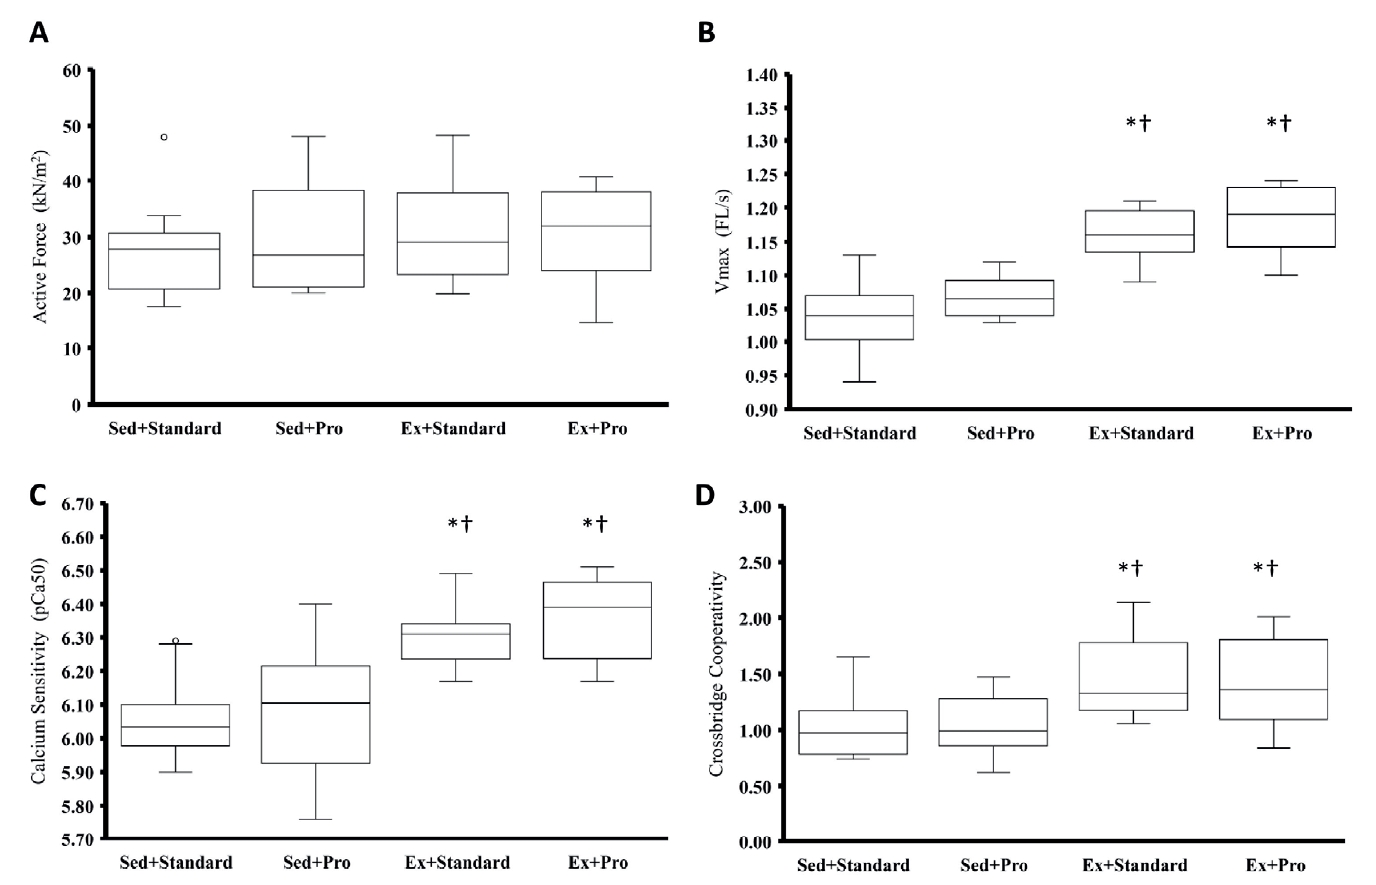
There were no differences in the maximal active stress production between groups (p = 0.535) (Figure 3A). Similarly, there were no differences between any groups for peak passive stresses or passive stress following stress relaxation for stretch magnitudes of 10% (p = 0.338) or 15% (p = 0.176) of the initial length (2.2 μm) (Table 3).
Unloaded shortening velocity
The maximum unloaded shortening velocity was significantly greater in hearts from Ex+Standard and Ex+Pro groups than that in both Sed+Standard (p = 0.001 and 0.001, respectively) and Sed+Pro (p = 0.001 and 0.001, respectively) groups (Figure 3B). However, there were no differences between the Sed+Standard and Sed+Pro (p = 0.497) or between the Ex+Standard and Ex+Pro (p = 0.579) groups.
Calcium sensitivity
Calcium sensitivity, measured using pCa50, was significantly greater in hearts from Ex+Standard and Ex+Pro groups than that in both Sed+Standard (p = 0.001 and 0.001, respectively) and Sed+Pro (p = 0.006 and 0.001, respectively) groups (Figure 3C). However, there were no differences between the Sed+Standard and Sed+Pro (p = 0.668) or between the Ex+Standard and Ex+Pro (p = 0.492) groups. nH was significantly greater in the Ex+Standard and Ex+Pro groups compared to those from the Sed+Standard (p = 0.003 and 0.019, respectively) and Sed+Pro (p = 0.007 and 0.037, respectively) groups (Figure 3D). However, there were no differences between the Sed+Standard and Sed+Pro groups (p = 0.868) or between the Ex+Standard and Ex+Pro (p = 0.617) groups.
Biochemical testing
Ex+Standard and Ex+Pro groups had significantly greater α-MHC composition (relative to total MHC) than that in both Sed+Standard (p=0.004 and 0.008, respectively) and Sed+Pro groups (p=0.008 and 0.013, respectively) (Figure 4A and 4B). Differences based on diet were not observed between the sedentary (p = 0.953) and exercised groups (p = 0.953). A significant correlation (r = 0.73; p = 0.001) between the α-MHC composition, total MHC, and maximum shortening velocity was noted (Figure 4C).
DISCUSSION
This study aimed to investigate the effects of dietary whey protein supplementation on the structural and mechanical properties of the heart in response to aerobic training in rats. The main findings were that animals in the aerobic exercise groups had increased heart volumes, greater unloaded fascicle shortening velocities, and increased calcium sensitivities compared with that in the non-exercise control group animals. The high-protein diet intervention did not produce any adaptations in the structure or function of the heart in the exercise-trained or untrained animals compared to that in animals fed a regular, low-protein, control diet.
Fitness indices
The training protocol used in this study has previously been shown to increase VO2max and time to exhaustion measured on graded exercise tests [8,12,27]. Both exercise groups performed significantly longer than that in the sedentary controls. However, there was no additional benefit from the addition of dietary protein.
Exercise has been shown to improve body composition and reduce overall body mass [33]. In a previous study, using the same training protocol and the same strain of rats, Boldt et al. [12] observed significantly lower body fat in aerobically trained rats than that in sedentary control animals. In the present study, we did not observe differences in body composition, although the trained animals did, on average, have lower body mass. The AIN93-M control standard diet was used in this study for its excellent control of protein sources, but it has a higher caloric content than that of other rat chow diets used in previous studies [34]. This greater caloric content may explain the lack of difference in body composition observed in the present study, as the energy cost of exercise did not overcome the high caloric density of the AIN93-M diet.
Cardiac structural adaptations to the enriched protein diet
Structural adaptations of the LV in response to exercise have been characterized [4,5,35]. Previous studies on swimmers and runners identified larger EDV and ventricular masses in athletes than that in age- and sex-matched nonathletes [3]. Spence et al. [4] found proportional increases in EDV and wall thickness after 6 months of aerobic running training in initially untrained subjects when compared to that of baseline values. Similarly, Baggish et al. [36] observed increased LV mass and volume in men and women, university teams, and long-distance rowers after 90 days of rowing-specific, intense aerobic training. The findings of the present study agree with the literature. While the LV dimensions did not change from baseline for sedentary animals, chamber volume indicated by EDV, LVIDd, and LVIDs significantly increased from baseline in animals from the Ex+Standard and Ex+Pro groups. Although there were no statistical differences between the exercise groups, all cardiac-specific increases were greater in Ex+Pro groups than that in Ex+Standard groups (EDV, 29% vs. 19%; LVIDd, 20% vs. 13%; LVIDs, 56% vs. 50%, for the Ex+Pro and Ex+Standard groups, respectively), suggesting that there may be small adaptations with the high-protein diet that were missed because of the relatively small number of animals used.
In skeletal muscles, the beneficial effects of protein ingestion are typically associated with an increase in MPS. Ingestion of a whey protein supplement following a resistance exercise training bout has been shown to result in a 125% increase in MPS, leading to greater muscle mass when continued chronically [13,37]. Hulmi et al. [38] observed significantly greater increases in muscle cross-sectional area and strength following a 21-week resistance training program in individuals consuming a protein supplement than in those receiving a placebo.
Under normal resting conditions, the heart replaces all its proteins over 30 days [39]. The turnover rate of muscle protein is approximately 83% greater in cardiac muscle than that in primarily slow-twitch type I fibered (soleus) and primarily fast-twitch type II fibered (gastrocnemius) muscles in rats [20]. These high rates of MPS potentially present a prime target for improving cardiac function through interventions, such as protein supplementation and/or exercise. Lollo et al. [40] evaluated the activity of the mammalian target of rapamycin (mTOR) anabolic pathway following 4 weeks of aerobic exercise and whey protein supplementation in rats and observed dose-dependent activation of these pathways in response to whey protein following treadmill exercise. To evaluate the potential role of protein supplementation in the rate of cardiac MPS, isolated heart preparations were infused with amino acid solutions [24,25]. Supplying leucine and other amino acid cocktails to isolated rat hearts resulted in a 25%-40% greater MPS compared to that of control conditions with normal amino acid levels [21,22]. Garlick and Grant [23] observed increased rates of MPS following intravenous injection of amino acids in rats, with the greatest effects observed in response to essential amino acid injections. These studies demonstrate the potential of the heart to respond to the supply of proteins.
We found that a high-protein diet had no effect on cardiac structure in the sedentary group. Lollo et al. [40] compared cardiac anabolic activity and total cardiac protein content following 4 weeks of leucine supplementation in untrained and sedentary rats. They observed minimal increases in mTOR phosphorylation with leucine in sedentary animals but did not detect differences in total muscle protein content. However, in combination with exercise, leucine led to significant activation of the mTOR pathway and increased protein content in the heart. Therefore, it is not surprising that in the present study, protein alone did not affect structural adaptation.
Cardiac mechanical adaptations to protein supplementation
In rats, cardiac contractility is reduced by obesity [41,42] and aging [43] and improved by exercise [8,9,44]. These alterations in contractility have been attributed to changes in maximal isometric stress production [12], calcium sensitivity [9,10], and maximal unloaded shortening velocity [7,8].
In the present study, the maximal active stress did not differ between groups. This is consistent with previous literature [7,8,10,27]. Although active stress production of the myocardium has been shown to be greater following resistance exercise training compared to that of sedentary controls [12], it has been consistently shown to be unchanged after 11 weeks of aerobic exercise in rats trained 5-7 days per week for 30-240 min per day [7,8,10,27].
In contrast to maximum active stress production, the sensitivity of the myocardium to calcium activation has been shown to increase following aerobic exercise [9,10,12]. Diffee et al. [9] compared calcium sensitivity in rat myocardium following a treadmill protocol similar to that used in the present study. They observed significantly greater pCa50 values (increased calcium sensitivity) in the myocardium from aerobically trained rats compared to that of the untrained control animals, but they did not observe differences in nH. Boldt et al. [12] compared calcium sensitivity following aerobic only, resistance only, or a combination of aerobic and resistance training and observed increases in pCa50 for the aerobic only and resistance only groups, but not for the combined aerobic and resistance training group. This lack of change in calcium sensitivity in the combination trained group was compensated, in part, by a significant increase in nH. In the present study, we observed an increase in pCa50 and an increase in nH for Ex+Standard and Ex+Pro groups. Increased calcium sensitivity with cardiac muscle stretching is thought to be a key factor for increased contractility with increasing length, as described by the Frank-Starling law of the heart [45,46]. An overall increase in calcium sensitivity achieved through increases in both pCa50 and nH, which we observed with exercise training, would increase contractility by enhancing the force of contraction for a given calcium concentration or by allowing the myocardium to produce the same ejection pressure with less active calcium handling.
Ejection power is a function of active stress production and the rate of shortening. Since maximum active isometric stress has been found to consistently remain unchanged with aerobic exercise, ejection power has been shown to be modulated primarily by shortening the velocity of the myocardium [7,8]. In line with our findings, Diffee and Chung [8] compared the isotonic force-velocity relationship following 11 weeks of aerobic exercise training in rats. They observed no differences in maximum isometric stress, but they observed greater rates of shortening at the corresponding relative force outputs and, consequently, a greater power output at corresponding forces and a greater peak power output. In contrast to Diffee and Chung [8], who did not find a statistical difference in the unloaded shortening velocity in single permeabilized myocytes, Boldt et al. [12] observed greater unloaded shortening velocities in the hearts after 12 weeks of resistance and 12 weeks of aerobic exercise training. However, the results by Diffee and Chung are likely due to issues of power in their statistical analysis, as the mean differences for the unloaded shortening velocity, reported by them in their Table 2, were substantial (trained [mean ± 1 SE] 1.41 ± 0.06 muscle length/s vs. untrained 0.87 ± 0.07 muscle length/s; Table 2) [8]. In contrast to Diffee and Chung [8], who did not find changes in MHC composition between their trained and untrained animals, we observed a significant correlation (r = 0.73) between α-MHC composition and shortening velocity, consistent with findings that exercise leads to a greater proportion of α- vs. β-MHC. Increases in α-MHC composition are correlated with increases in cardiac tissue-unloaded shortening velocity [47-49].
We did not observe differences between groups for maximum active stress production or passive stress measured at an average sarcomere length of 2.42 and 2.53 μm. However, animals in the exercise groups had higher maximal rates of shortening, greater calcium sensitivity, and greater crossbridge cooperativity compared to that of the sedentary group. The magnitude of these differences was similar between the Ex+Standard and Ex+Pro groups, suggesting no additional benefit of the high-protein diet on the mechanical properties of the myocardium. Similarly, the high-protein diet did not produce differences in the mechanical properties of the sedentary groups (Sed+Standard and Sed+Pro).
Ergogenic effect of protein with exercise
There may be several reasons why we did not observe enhanced cardiac structural or mechanical adaptation with the addition of a high-protein diet in combination with aerobic exercise. First, protein supplementation may have no effect on cardiac adaptation to exercise. The heart is a critical organ, and unlike the skeletal muscle, the body would likely prioritize the delivery of amino acids to the heart for recovery. Protein-restricted diets (6% protein) have been shown to result in negative cardiac structural and contractile remodeling [50,51], but the standard diet in this study had a 13% protein content, which was likely sufficient for proper adaptation of the heart to external stimuli and increased demand.
The change in heart volume did not differ statistically between the two exercise groups, but was consistently larger for EDV and LVID in the Ex+Pro group (29% and 20%, respectively) compared to that of the corresponding values in the Ex+Standard group (19% and 13%, respectively). These small differences, with an observed power of 65%, might have been lost owing to a lack of statistical power. In the present study, echocardiography was used to measure the overall cardiac structure. However, since microscopic cardiomyocyte hypertrophy was measured, differences in cardiac muscle hypertrophy that were not captured by echocardiography at the whole heart level in the selected planes may have been detected.
There is strong evidence that skeletal muscles can optimize anabolic response following resistance training [52,53]. We chose whey protein in this study because it has been shown to be an effective supplement for skeletal muscle adaptations. It is a complete protein, has a high rate of uptake from partial hydrolysis, and has a high leucine content [13,37]. Our protein-supplemented diet had twice the protein content than that of the standard diet. The effects of whey protein on skeletal muscle adaptations have been shown to depend on the dose [54,55] and timing of ingestion relative to the resistance training bout [56-58]. We supplied protein to the animals’ food; therefore, the timing of ingestion relative to the training bouts was not controlled, and food intake was likely distributed throughout the day. Thus, the single-dose load was probably small and not optimally timed relative to the socalled anabolic window that opens following a training session [58]. It is possible that single-dose supplements administered after daily exercise training sessions would have been more effective than generic supplementation through food.
There was potentially a time effect of the whey protein diet that was not captured in our study design. For example, if the cardiac tissue adaptations in the Ex+Pro group occurred at a greater rate than that in the Ex+Standard group and then plateaued, the Ex+Standard group caught up with these adaptations in the 12-week intervention period. Similarly, cardiac structure in the Ex+Pro and Ex+Standard groups adapted from baseline, but it remains unknown how they might have continued to adapt if the intervention period was longer than 12 weeks. Cardiac tissue adaptations in the Ex+Standard group would have eventually plateaued, whereas they may have continued to adapt in the Ex+Pro group. However, these are all speculations, and further work should be done to confirm whether there is an ergogenic effect of protein supplementation on cardiac adaptation with aerobic exercise training. Similarly, further work should include direct measures of blood pressure, adaptations of the renin-angiotensin system, cardiac MPS, and molecular measures to evaluate glucose and fatty acid metabolism of the heart, along with measures of mitochondrial content and function.
Based on the results of this study, we conclude that 12 weeks of aerobic exercise training leads to both structural and mechanical adaptations of the heart. However, the addition of a high-whey-protein diet did not enhance these adaptations in comparison to a regular protein control standard diet.