Effect of leucine uptake on hepatic and skeletal muscle gene expression in rats: a microarray analysis
Article information
Abstract
[Purpose]
This study was performed to explore the physiological functions of leucine by exploring genes with leucine-dependent variability using DNA microarray.
[Methods]
Sprague-Dawley rats (n = 20) were separated into a HPD (30% High Protein Diet, n = 10) group and a NPD (0% Non Protein Diet, n = 10) group and fed a protein diet for 2 weeks. At the end of the 2-week period, the rats were fasted for 12-16 hours, further separated into subgroups within the HPD (Saline, n = 5, Leucine, n = 5) and NPD (Saline, n = 5, Leucine, n = 5) groups and administered with a leucine solution. The liver and muscles were harvested after 2 hours for RNA extraction. RNA purification from the isolated muscles and target gene identification using DNA chip were performed. The target gene was determined based on the results of the DNA chip experiment, and mRNA expression of the target gene was analyzed using Real-Time PCR.
[Results]
In the skeletal muscle, 27 genes were upregulated while 52 genes were down regulated after leucine administration in the NPD group. In the liver, 160 genes were up-regulated while 126 were down-regulated. The per2 gene was one of the genes with leucine-dependent induction in muscles and liver.
[Conclusion]
This study was performed to explore the physiological functions of leucine, however, a large number of genes showed variability. Therefore, it was difficult to definitively identify the genes linked with a particular physiological function. Various nutritional effects of leucine were observed. High variability in cytokines, receptors, and various membrane proteins were observed, which suggests that leucine functions as more than a nutrient. The interpretation may depend on investigators’ perspectives, therefore, discussion with relevant experts and the BCAA (Branched-Chain Amino Acids) society may be needed for effective utilization of this data.
INTRODUCTION
Mammalian skeletal muscles can regenerate following injury. This mechanism of muscle regeneration includes an initial inflammatory myofiber necrosis followed by the activation [1]. In skeletal muscle regeneration following injury, BCAAs (Branched-Chain Amino Acids) of required proteins have been reported to be important [2].
BCAAs are amino acids with aliphatic side-chains such as valine, leucine, and isoleucine. These nutritionally essential amino acids are not synthesized in vivo. The nutrition and health status in people with or without disease largely depend on the deficiency status of BCAAs. Therefore, BCAA must be obtained externally from food [3].
In particular, BCAAs play an important role in the maintenance and increase of skeletal muscle. They also regulate skeletal muscle metabolism, that is, BCAAs promote protein synthesis and inhibit protein catabolism [4]. Especially, leucine is known to demonstrate this effect and to stimulate protein synthesis via the m-TOR system.
Previous studies have reported that leucine complements other essential amino acids, and induces phosphorylation of mTOR [5-7]. The mTOR system modulated by leucine is an essential phase for the activation of factors involved in downstream target mRNA translation and muscle regeneration [8,9]. It is also an important signal transduction system that regulates growth factors and amino acid mRNA translation in skeletal muscle.
Although the molecular mechanism of BCAA for inhibiting protein catabolism has not yet been fully elucidated, it is believed that there is a sensory system for perceiving the intracellular leucine level and controlling the catabolism system. Recently, the lysosome system-mediated protein catabolism process and amino acid transport-mediated intracellular BCAA absorption have been being actively investigated. In particular, the mechanism for the transporter related signal transduction system that controls metabolism in vivo has been of high interest [10,11].
Additionally, with central venous feeding of glucose or amino acid solutions to rats in the active or inactive phase, differences in feeding time were found to cause large changes in the circadian rhythm in the intracerebral suprachiasmatic nucleus (SCN) and in peripheral clocks. Therefore, in vivo responses caused by BCAA administration, including the primary or secondary effect on glucose and fatty acid metabolism, hormonal response etc., are likely to have various mechanisms [12,13].
The master clock controlling the circadian rhythm in mammals including humans is located in the intracerebral suprachiasmatic nucleus (SCN). The circadian rhythm regulates hormone release at the SCN, and per2 is one of the genes involved in the generation of the circadian rhythm [14].
Skeletal muscles have a biologic cycle is similar to almost all organs and tissues in the body [15] which regulates the expression of genes involved in transcription and muscle generation [16].
Per2 gene mutation was found in human sleep-wake rhythm disorders such as advanced sleep phase syndrome, delayed sleep phase syndrome, and 24-hr sleep wakefulness syndrome. Induction of Per2 gene expression may change the biologic rhythm. In rats, it was reported that central venous feeing in the inactive epoch (light period) reversed the light/dark rhythm. Thus, feeding timing is believed to be important for maintaining normal biological rhythm.
Protein synthesis and catabolism are essential to maintain vital phenomenon. They are usually repeated intracellularly and the balance is modulated under various physiological conditions. Major pathways that are part of the intracellular protein catabolism system largely depend on nutrition status and external stimuli [17].
Particularly, protein catabolism is remarkably accentuated during starvation to compensate for protein deficiency. The accentuation of lysosome system-mediated protein catabolism is dependent on amino acid concentration including BCAAs, indicating the presence of sensory molecules for amino acid concentration. [18].
Therefore, this study was conducted to analyze the expression of genes dependent on the intake of leucine by BCAAs, subsequently affecting protein synthesis and catabolism. The leucine-dependent genes could then be investigated to infer the physiology and the series of responses induced by BCAAs.
Consequently, the purpose of this study was to explore the physiological functions of leucine by extensive translation of genes with leucine-dependent variability using DNA microarray. More quantitative analysis of genes of interest with variability was performed using real time PCR.
METHODS
Subjects
Sprague-Dawley rats (n = 20) were separated into a HPD (30% High Protein Diet, n = 10) group and a NPD (0% Non Protein Diet, n = 10) group and fed a protein diet for 2 weeks. The rats were maintained in a 12 hour light/dark cycle at constant room temperature 22 ± 1℃ and relative humidity 55 ± 3%. Dietary composition was as shown in <Table 1>.

Components of diet
Leucine treatment
After 2 weeks on a protein diet, the rats were fasted for 12-16 hours and separated into sub groups within the HPD (Saline, n = 5, Leucine, n = 5) and NPD (Saline, n = 5, Leucine, n = 5) groups followed by oral administration (2.5ml/100g BW) of a leucine solution (5.4%, w/v) or saline (control). Liver and muscles were harvested for RNA extraction at 2 hours post-dose, and RNA purification from the isolated muscles was performed as well as target gene identification using DNA chip. The target gene was determined based on the results of the DNA chip experiment, and mRNA expression of the target gene was analyzed.
RNA extraction and analysis method
RNA extraction and analysis were performed using Agilent 2100 Bioanalyzer (Japan) equipment by Hokkaido System Science Co., Ltd. Bio Development Division, Microarray team. The results of RNA extraction and quality control were as follows. RNA quality was tested with the Agilent 2100 Bioanalyzer and sample results for the respective specimens (electropherogram、GelImage) are illustrated in <Fig. 2>.
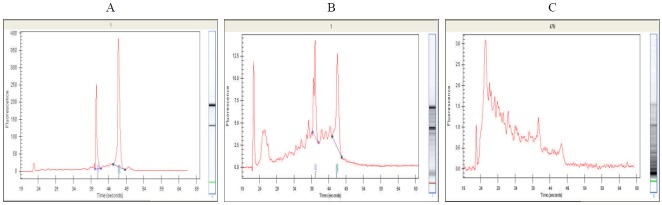
Electropherogram (GelImage)
Figure A clearly shows an example of the electropherogram peaks for non-degraded RNA 18S and 28S rRNA while figure B shows the baseline in disorder due to partially degraded RNA products. Finally, figure C shows an example of the peaks of nearly degraded RNA, which have low-molecular weight due to degradation products. As shown in <Fig. 3>, no RNA degradation occurred. All of the specimens were extracted well and used in this study.

Electropherogram (GelImage) of sample
Microarray analysis
Microarray was performed using samples obtained through RNA extraction. Microarray analysis compares relative gene expressions between two biologically different experimental materials. Labelled cRNA synthesized using T7RNA polymerase from cDNA synthesized from experimentally-extracted RNA was hybridized to microarray. Gene expression was analyzed using data obtained from microarray analysis in this study <Fig. 4>.
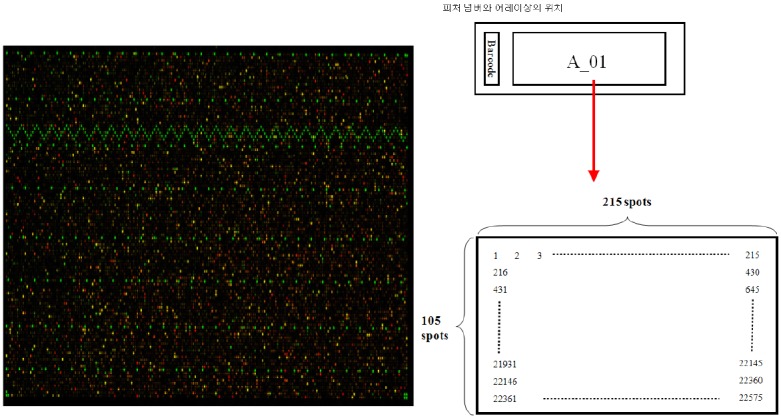
DNA microarray chip and scan image
Secondary study design and Real-Time PCR
The primary purpose of the study was not to determine genetic variability over time in the gene expression following leucine administration. Therefore, another study was designed to investigate the translation of post-dose genetic expression as shown in <Fig. 5>. Rats (n = 50) were placed into a single 0% Protein Diet group, and the study progressed after 2 weeks of feeding and 12-16 hours of fasting. Rats were separated into a leucine solution (5.4%, w/v) group (n = 25) and a glucose group (n = 25). The rats were sacrificed at 0h, 30min, 1h, 2h, and 4h post-dose and the liver and skeletal muscles were isolated.
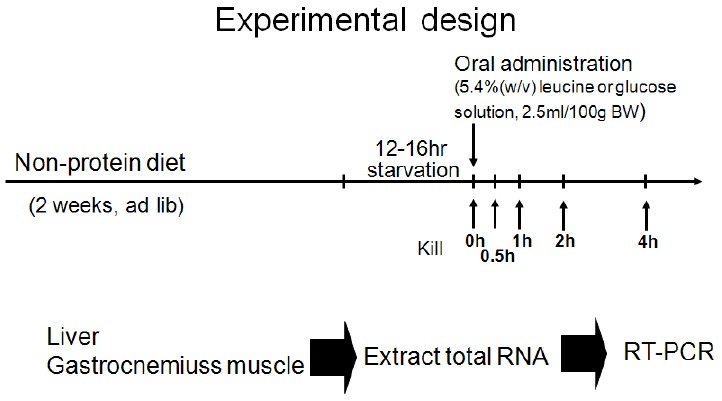
Experimental design
Polymerase chain reaction, PCR, was performed for quantification of Per 2 mRNA from isolated liver and skeletal muscles.
The reagent used for real time PCR (BIORED, iCycler iQ Optical System Software Version 3.0a) was from the One Step SYBR RT-PCR Kit (TaKaRa, Japan). The primer was prepared using primer3 version 0.4 (Web software provided by Steve Rozen and Whitehead Institute for Biomedical Research).
RESULTS
In this study, gene expression following orally administered leucine in rats was translated using the DNA microarray of RNA extraction from isolated tissue. Agilent Technologies Co., Ltd. Rat oligo Microarray was used, with approximately 21,500 genes spotted. Translation by microarray analysis was performed with the cross reference method, using the reference RNA to enable comparison between groups. For comparison of gene expression between groups, for example, scatter plots were created as shown in <Fig. 6>.

Analysis of gene expression using DNA microarray in scatter plot
<Fig. 6> shows data obtained after leucine administration in the HPD group and in the NPD group, plotted on the Y and X axes, respectively. The red line indicates gene expression that was more than double the value of the boundary of the variation domain. The induced gene expression and changes were thus determined, and the results in <Fig. 5> and <Fig. 6> were obtained from the actual number of genes that exceeded the red line. Each figure presents the number of genes with more than double expression.
Gene expression in skeletal muscles and liver
Genes were categorized and recorded as a group with known function (Known), a similar group (Similar) and a group with unknown function (Unknown).
As summarized in <Fig. 7>, 27 genes in skeletal muscle were upregulated while 52 were down regulated after leucine administration in the NPD group. 59 genes in the similar group showed upregulation while 83 genes showed down regulation. In the group with unknown function, 39 genes showed upregulation while 54 genes showed down regulation. 32 genes were upregulated while 46 were down regulated after leucine administration in the HPD group. In the similar group, 40 genes showed upregulation while 94 genes showed down regulation. In the group with unknown function, 29 genes showed upregulation while 61 genes showed down regulation.

Expression of genes that were more than doubled in skeletal muscle
As summarized in <Fig. 8>, 160 genes in the liver showed upregulation while 126 genes showed down regulation after leucine administration in the NPD group. In the similar group, 52 genes showed upregulation while 32 genes showed down regulation. In the group with unknown function, 50 genes showed upregulation while 33 genes showed down regulation. 73 genes showed upregulation while 66 genes showed down regulation after leucine administration in the HPD group. In the similar group, 15 genes showed upregulation while 29 genes showed down regulation. In the group with unknown function, 19 genes showed upregulation while 16 genes showed down regulation.

Expression of genes that were more than doubled in Liver
List of genes with more than doubled expression
Genes with more than doubled expression due to leucine-dependent induction in both muscles and liver are listed in <Table 2>. No functional bias was observed in the listed genes, however, variability was high in cytokines, various receptors and transporters. This variability was also observed in genes not listed in <Table 2>. Especially, the Per2 (Period 2) gene, which generates the circadian rhythm, showed variability in both the liver and skeletal muscles.

List of genes up-regulated after leucine administration in Rat
Change in Per2 gene expression
Investigation of the mRNA expression pattern of the Per2 gene, which was more than doubled by leucine-dependent induction in both muscles and liver, using Real-time PCR revealed significant increases at 2 hr and 3 hr post-dose in the leucine group (p<.05). Additionally Per2 gene expression at 2 hr post-dose was significantly higher than in the glucose group (p<.05).
DISCUSSION
Gene expression in skeletal muscles and liver
The number of genes with known function that demonstrated variability in muscles was not substantial. 27 genes were upregulated while 52 were down regulated after leucine administration in the NPD group. In the liver, 160 genes were up-regulated while 126 genes were down-regulated. There was substantial difference in the numbers of variable genes.
The number of variable genes in the liver was significantly higher in the NPD group than in the HPD group, and the leucine-induced effect seemed more pronounced in the NPD group. Interestingly, regardless of leucine administration, genes with differences in expression in both the liver and muscles were found in the NPD and HPD groups.
Comparison between the two protein diet groups without leucine (30S, OS) in the liver revealed twice the expression of 302 genes in the NPD group than in the HPD group. The opposite was observed for 181 genes. A higher level of gene expression after leucine administration was found in 151 genes in the NPD group, and in 51 genes in the HPD group.
These observations were attributed to protein deficient diet-dependent gene expression variability, caused by limited protein intake rather than by leucine administration. Among the genes with higher leucine-independent expression in the NPD group than in the HPD group, genes coding ribosomal protein (30 types), genes involved in lipid metabolism (fatty acid synthase, fatty acid desaturase1,2, HMG-CoA reductase, and carnitine palmitoyl transferase) and genes coding hexokinase and Malic enzyme were identified. It would be interesting to investigate nutrition capable of lowering gene expression to the level of the HPD group.
List of genes with more than doubled expression
Alteration of the expression level of Per2 in the mammalian biologic cycle by leucine may indicate a notable nutritional effect. In the liver, the expression of HMG-CoA reductase was induced. The effect of leucine on lipid metabolism has not yet been elucidated, hence investigating its effect on cholesterol metabolism may be interesting. Although it was expected that weight loss in the NPD group was caused by accentuated protein catabolism and that expression of the protease group was induced, there was no substantial change in expression in the lysosome system or in the proteasome system. Therefore, control of enzyme activity rather than protein level is likely to regulate protein catabolism.
Change in Per2 gene expression
Every mammalian cell has an approximately 24-hr biological cycle for daily environmental changes. Though intracerebral clock in the suprachiasmatic nucleus (SCN) has been actively investigated, the heart, skeletal muscle and peripheral tissues were only studied recently. In skeletal muscles, genes involved in biological rhythm such as Bmal1, Per1/2, Cry1/2, and Clock are the primary focus.
Previous studies to define gene expression from observing the biological rhythm in skeletal muscles identified 217 genes, most of which were involved in metabolism, transcription and muscle signaling [16]. Another study to determine changes using samples collected every 2 hr for a period of 48 hours investigated variability in over 2300 genes [19], distinguishing between MyoD1 and Bmal1 [20]. However to date, variability in the Per2 gene induced by leucine has not been reported. Therefore, investigating the effects of leucine administration on the genes with leucine-induced doubled expression may provide information about biological systemic control.
As shown in <Fig. 9>, leucine increased Per2 gene expression by more than 3 times after 1 hr.

Expression of Per2
Leucine-independent Per2 gene expression in muscles is known to be higher in the NPD group than in the HPD group. Per2 gene expression may serve a function beyond biological rhythm. It would be interesting to investigate the relationship between the amount of protein intake and Per2 expression as well as the casual relationship between Per2 expression and amino acid intake including BCAA intake.
Leucine-induced Per2 expression suggests that leucine may be employed like melatonin for the treatment of jet lag. Translation of biological rhythm requires changes over time for 24-hr, however, this study investigated only changes up to 4 hr post-dose. Therefore, further detailed translation involving clock genes other than Per2 is needed.
CONCLUSIONS
Given the results from studies reported to date, leucine has various physiological functions, including not only utilization for protein composition, precursors or intermediates of TCA cycle but also regulation of protein metabolism. In skeletal muscle, 27 genes were upregulated while 52 genes were down regulated after leucine administration in the NPD group. In the liver, 160 genes were up-regulated while 126 genes were down-regulated. Per2 gene was one of the genes with more than double leucine-dependent expression in the muscles and liver.
This study was conducted to explore the physiological functions of leucine. However, a large number of genes showed variability. Therefore, it was difficult to definitively conclude which gene was linked with a particular physiological function. Various nutritional effects of leucine were identified. High variability was observed in cytokines, receptors, and various membrane proteins, which suggests that leucine is more than a nutrient. This interpretation may depend on the investigators’ perspectives, therefore, discussion with relevant experts and the BCAA (Branched-Chain Amino Acids) society may be needed for effective utilization of this translation data.
Acknowledgements
This research was supported by the 2004 Korea Research Foundation Grant, as part of post-doc fellowship program by Korea Research Foundation (KRF-2004-037-G00060).
