


INTRODUCTION
Brain derived neurotrophic factor (BDNF, 14-kDa) is a member of the neurotrophic factor family [1] such as nerve growth factor, neurotrophin-3, neurotrophin-4/5, and neurotrophin-6 and a protein encoded by the BDNF gene [2]. It is known that BDNF plays a major role in controlling structural and functional plasticity of the brain and improving learning and memory functions. Arbitrary participation on exercise may, therefore, increase mRNA in BDNF and protein in hippocampus and other areas of the brain [3].
A recent study mentioned that increase in mRNA in BDNF and protein followed by skeletal muscle contraction is caused by histone deacetylease suppression. This rational came from previous animal studies showing expression of mRNA in BDNF during the suppression of histone deacetylease [4]. Likewise, mRNA in BDNFexpression and protein during skeletal muscle contraction has been expected to provide a positive effect on improvement of energy homeostasis and circulation of BDNF. Moreover, it has been asserted that mRNA of BDNF expression and protein during skeletal muscle contraction is linked with metabolic disorders such as obesity and diabetes [5-8]_ENREF_5].
It has been reported that mid-aged Korean women have a noticeable change of mood swing induced by low level of exercise and a higher risk of metabolic disorders due to a decrease in fitness level [9,10]. Besides, it has been also reported that mid-aged women with depression have decreased level of BDNF [11]; however, information on exercise method for increasing BDNF is limited. Also, as decision on exercise duration and intensity is answered personally by participants, it is difficult in conducting aerobic exercise and skeletal muscle training while keeping the level of exercise duration and intensity consistent for all individuals. Also, it is hard to determine which of the factors, aerobic exercise and skeletal muscle training, were responsible for the effect on BDNF. Although acute aerobic exercise increased the level of serum BDNF [12,13], there are not enough studies focusing on long term exercise effect related to BDNF change and cardiometabolic risk factors. Moreover, most previous studies reported that serum BDNF level has not been significantly increased from skeletal muscle training [14-16]. Therefore, combined exercise of aerobic and resistance exercise may have a positive effect on decreasing metabolic risks and increasing level of BDNF level in mid-aged women.
METHODS
Characteristics of participants
One hundred ninety six women living in Kyungki-doY and S city (age range 20 to 48 years) were first recruited and all of them were screened. Individuals were removed from the experiment if they met any one of the following conditions. 1) age below 40 years (n = 68), 2) performing moderate physical activity ≥ = 60 minute per week (n = 42), 3) making voluntary refuse (n = 18), and 4) having medical problems such as blood pressure ≥ = 160/100 mmHg, cardiovascular disease history, fasting triglyceride level ≥ = 500mg/dL, diabetes, and etc. (n = 38). After the screening procedure, 30 mid-aged women participated in this study (See Fig. 1.).
Method of composing exercise group and exercise intervention
First, 30 mid-aged women, according to their exercise preference, was randomly assigned as non-exercise group (n = 7, control group; CG) and exercise group (n =23). Then, 23 exercise participants were divided into aerobic exercise group (n = 15, AEG) and combination of aerobic and resistance exercise group (n = 8, CEG). Exercise preference of all participants was confirmed to reduce drop out of long term exercise program and maximize motivation.
CG was asked to perform over moderate physical activity ≤ 60 minutes per week and stretching ≤ = 20 minutes per day during 6 months. AEG was asked to perform ab exercise 4 times per week with an intensity of 50-80% maximal oxygen uptake (VO2max) during the 6 months. Phased exercise intensity was conducted by phase 1 as 50% (1-4 week), phase 2 as 50-60% (5-10 week), phase 3 as 60-70% (11-16 week), and phase 4 as 70-80% (17-24 week). Total exercise time was 60 minutes including 10-minute warm-up, 40-minute main exercise, and 10-minute cooling down. Exercise intensity was calculated by VO2max reserve while target VO2max from VO2max at baseline and treadmill speed at grade 0% using the following equation; VO2(ml/kg/min) = 0.1(speed) + 1.8 (speed)(fractional grade) + 3.5ml/kg/min [17]. This equation, moreover, was individually applied to each training phase.
CEG and AEG was asked to perform aerobic exercise by 2 times per week and they were conducted as 2 set (1 set: 1 RM 30%, 2 set: 1 RM 40%) of 4 upper body exercise (bench press, seated row, shoulder press, and lat pull down) and 2 set (1 set: 1 RM 30%, 2 set: 1 RM 40%) of 3 leg exercise (leg press, leg extension, and flexion) based on 1 maximum repetition testing. All exercise training was conducted under trainers’ supervision.
VO2max and maximal strength assessment
VO2max assessment considering participants’ age was conducted by electronic treadmill using modified Bruce protocol [18]. To assess VO2max, standard open-circuit spirometer technique (Quark b2metaboliccart, Cosmed, Italy) was used and heart function was assessed by EKG monitor (QMC2500; Quinton, USA). All participants were motivated and encouraged in order to keep up a maximal performance. VO2max was calculated by havingat least 3 following conditions; 1) no more increase in VO2max, 2) reach over 17 points in Borg RPE scale, 3) no more voluntary exercise performance, and 4) reach maximal heart rate (calculated from individual age). Muscular strength in the thigh was measured by isokinetic machine (Isomed 2000, D&R, Germany) at angular velocity of 60°/sec.
Body composition
Body composition was measured by the impedance machine, In Body3.0 (Biospace, Anyang, Korea) using DSM-BIA (Direct Segmental Multi-Frequency Body Impedance Analysis) method. With maximum 1000 kHz and minimum 1 kHz, 6 types of wave (1, 5, 50, 250, 500, 1000 kHz) were used through minute electric currents. Percent body fat and fat-free mass were calculated. Height and body weight were measured by standardized extensometer and scale.
Blood analysis
To analyze serum BDNF concentration, blood was drawn on forearm vein after fasting for 12 hours and centrifuged (at 4℃, 1000 × g, 15 minutes) by Backman Coulter vacutainer system (Vacutainer, Becton Dickinson Vacutainer System, Franlin Lakes, NJ). Collected blood samples were stored in the freezer at -80℃ until blood analysis and two-site sandwich enzyme-linked immunosorbent assay (ELISA) kit (Abfrontier (Korea)) was used for serum BDNF analysis with plate reader (Bio-Rad, Micro plate 680, USA). ELISA kit sensitivity was < 2 pg/mL and intra-assay and inter-assay displacement was ± 3.4% and ± 7.6%, respectively. Divided plasma and serum of all participants was moved to the micro tube and analyzed to check fasting glucose, triglyceride(TG), total cholesterol (TC), high-density lipoprotein cholesterol (HDL-C), and glucose by using UV spectrophotometer (U-2800, Hitachi, Japan). Fasting insulin was analyzed byELISA kit (ALPCO Diagnostics, Salem, NH, USA) and insulin resistance was used by assessment-insulin resistance (HOMA-IR = [fasting insulin (uU/ml) × fasting glucose (mM)] / 22.5) [19].
Data analysis
All collected data was expressed by mean and standard error. Descriptive statistics was calculated for each variable and one way ANOVA was used to test the variance between thegroups prior to the exercise. Changes in body composition, fitness level, and blood BDNF level was tested for group differences in pre and post exercises through one way ANOVA. Bonferroni post-hoc method was used to test between-group difference. All data were analyzed with SPSS 16.0 for Windows (Chicago, IL, USA) and statistical significance was set at p < 0.05 for all tests.
RESULTS
Characteristics of participants
All participants’ mean age (SE) was 43۟ years and mean body weight was 58.59۰.35 kg. Mean body mass index (BMI) of all participants was 23.22۟.69 kg/m2. At baseline, there was no significant difference in body composition, blood pressure, fitness, and blood factors (See table 1).
VO2max, maximal strength, and body composition
Changes in body composition at baseline and after exercise intervention showed that CG had increased trend of BMI and percent body fat. AEG and CEG, however, showed a decreasing trend of BMI and percent body fat. Also, there was a significant decrease of BMI and percent body fat in AEG and CEG compared to CG (p < 0.05), while there was no significant difference between AEG and CEG (See table 2). There was a significant increase only in VO2max changes of AEG compared to CG (p = 0.042). Maximal flexion strength (p = 0.009) and maximal extension strength (p = 0.005) were significantly increased only in CEG compared to CG (See table 2).
Blood analysis
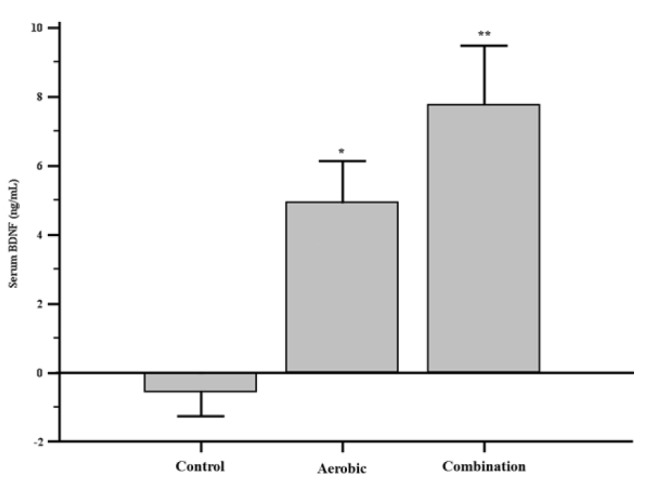
After 24 weeks, there was significant serum BDNF level changes in AEG and CEG compared to CG (F = 6.328, p = 0.001) There,however, was no significant difference in AEG and CEG (See Fig. 2). TG (p = 0.043) and TC/HDL-C (p = 0.042) were significantly decreased only in CEG compared to CG and there was a significant increase in HDL-C of AEG compared to CG (p = 0.013). However, there was no difference between the groups in TC, TG/HDL-C, fasting glucose and insulin, and HOMA-IR (See table 2).
DISCUSSION
Major findings of this study are as follows; 1) there was a significant difference in BMI and percent body fat after 24-week exercise intervention, which showed no significant difference in AEG and CEG compared to CG, 2) after 24-week exercise intervention, AEG showed a significant increase in VO2max, HDL-C, and serum BDNF level compared to CG, 3) there was a significant increase in serum BDNF of CEG and a significant decrease in TG and TC/HDL-C of CEG, and 4) there was no significant difference between AEG and CEG.
Generally, it has been well known that regular training induces a positive effect on body composition changes, decreases in blood cholesterols such as TG, TC, and LDL-C [20], an increase in HDL-C [21], increases in insulin sensitivity [22]. Especially, it has been reported that percent body fat and blood cholesterols have a negative relationship with insulin sensitivity and there existed a positive relationship in HDL-C and aerobic capacity [22]. Although it was observed that regular aerobic exercise induced decreased percent body fat and significantly increased HDL-C in mid-aged women, combined exercise showed significant changes in percent body fat, muscular strength, TG, and TC/HDL-C and higher changes in TC, TG/HDL-C, glucose, insulin, and HOMA IR compared to aerobic exercise without statistical significance. Thus, it seems that combined exercise have a positive effect on improving metabolic risk factors in mid-aged women as CEG had significantly different variables compared to AEG (percent fat) and CG (BMI, percent fat, peak torque flexion and extension, TG, TC/HDL-C) and there was no noticeable metabolic risk factors in AEG and CEG. Similar to this study, Park et al. [23] reported that combined exercise showed a more positive effect on improving VO2max, percent body fat, blood cholesterols, and lipoproteins than aerobic exercise after 24-week intervention in mid-aged obesity women. Our conducted study used similar muscular strength exercise frequency of CEG as that of Park et al. (2003)’s study however, our study used 30% lower exercise intensity (1RM, 30-40%) compared to (1RM, 60-70%) and this may be reflected in the results.
For healthy adults, it is recommended that exercise intensity of aerobic and resistant exercise to be divided into moderate exercise ≥3-5 days per week and high intensity exercise ≥ = 2-3 days per week [24]. All participants, therefore, were supervised by this guideline. The present study conducted a 60-minute moderate level of combined exercise for 4 days per week for 6 months in mid-aged women, andVO2max induced by muscle hypertrophy and increased muscular strength is expected improve. However, results showed that VO2max of AEG was significantly improved compared to CG while changes in VO2max of AEG were greater than that of CEG. While the cause of such result is unclear, having conducting both aerobic and resistance exercise on the same day may have affected restricted muscle hypertrophy and muscular improvement [25] along with lower level of muscular strength exercise intensity(1 set, 1 RM: 30-40%). Eventually, it seems that this might cause lower improvement in VO2max of CEG compared to AEG. Comparing muscular strength of CEG and CG, we also found that there was a greater differences in CEG and CG than AEG and this in agreement with the previous study [25]. They commented that one-time exercise and chronic exercise training caused muscular strength induced by improved muscle hypertrophy.
Several previous studies proved that acute aerobic exercise increased serum BDNF level [26-30] and similarly, we have previously reported [13] an improved serum BDNF level after acute aerobic exercise intervention. Therefore, it can be easily considered that long term aerobic exercise can cause increased serum BDNF level. Erickson et al. [31] and Ruscheweyh et al. [32] reported that increased serum BDNF level after 6 and 12-month aerobic exercise intervention for older adults corresponds with our study results. On the other hand, Griffin et al. [27] found that there was no change in serum BDNF level after 3-5 week aerobic exercise intervention for young male adults, which contradicts results from both Erickson et al. [31], Ruscheweyh et al. [32], and our current results. Although exercise intensity of our study was similar to that of Griffin et al.’s [27] (60% VO2max), Erickson et al. [31] and Ruscheweyh et al. [32] (60-80% VO2max), young male adults participating in aerobic exercise caused higher changes in BDNF revelation of muscle [33], adipose cells [34], other peripheral nerves, and brain tissue [1] compared to mid-aged women and older adults. Therefore, the results from the three studies seem to be inconsistent. Also, no difference in aerobic exercise and combined exercise caused any significant serum BDNF concentration and this may be due to lower combined exercise intensity (1 set, 1 RM: 30-40%). Huang et al. [35] expected that increased BDNF level induced by acute exercise is relatedto exercise intensity. According to this expectation, we may conclude that combined exercise might not induce more significantly increased serum BDNF concentration than aerobic exercise.
This study had the following limitations; 1) dietary intake and nutritional supplementation of all participants was not considered, 2) cognitive function effects on serum BDNF changes during training period was not regarded, 3) abnormal menstrual status of each participant was not considered as one of confounding factors on BDNF changes in mid-aged women, and 4) BDNF changes and circulating BDNF level (serum, plasma, platelet) at baseline, after treatment, and recovery phase was not calculated.
CONCLUSION
Aerobic exercise and combined exercise resulted in a significant decrease in body fat of mid-aged women during the 24 weeks. Comparing baseline change for the 24 weeks, VO2max and HDL-Cwere significantly increased for AEG and CG. Significant levels of TG and TC/HDL-C was decreased in CEG during the 24 week period. Moreover, serum BDNF concentration for both AEG and CEG was significantly increased compared to CG. However, there was no significant difference between the groups. Although there was no difference in serum BDNF level between AEG and CEG, we confirmed that CEG may evoke a positive change in BDNF increase of mid-aged women.