


INTRODUCTION
Obesity is a heightened state of inflammation. The adipose tissue is an active secretory organ that produces and releases a variety of proinflammatory [e.g., interleukin-1beta (IL-1╬▓), leptin, tumor necrosis factor-alpha (TNF-╬▒), IL-6] and anti-inflammatory proteins (e.g., IL-10, interleukin-1 receptor antagonist). TNF-╬▒ is also over-expressed in adipose and muscle tissues of obese humans, and when administered exogenously leads to insulin resistance [1-3].
Quercetin exhibits antioxidative properties that are much stronger than those of vitamin C as well as anti-inflammatory [4,5] and anti-pathogenic properties [6]. Phenolic compounds selectively interfere with cytokine production and function. For example, quercetin and catechins inhibit TNF-╬▒ and IL-6, and simultaneously induce IL-10 release, and thus evoke the anti-inflammatory effect [7].
Exercise can have both positive and negative effects on inflammatory and redox status. While moderate activity may enhance immune function over sedentary levels, excessive, prolonged and high-intensity exercise may impair immune function [8]. Strenuous exercise increases production of several pro-and anti-inflammatory cytokines, endogenous cytokine inhibitors and chemokines [9]. Plasma IL-6 has been consistently shown to increase following acute knee-extensor, cycling, and resistance exercise [10]. Additionally, muscles release inflammatory cytokine during acute exercise, and levels can increase significantly [11]. Obesity and type 2 diabetes have been associated with a high-fat diet (HFD) and reduced mitochondrial mass and function [12]. Furthermore, peroxisome proliferator-activated receptor gamma coactivator-1 (PGC-1╬▒) is important in the development of diabetes mellitus [13] and a master regulator of oxidative phosphorylation gene expression and mitochondrial biogenesis [14].
Given the similarity in the structure of quercetin to resveratrol and other flavonoid derivatives that have been shown to increases PGC-1╬▒ leading to mitochondrial biogenesis, oxidative phosphorylation contributes to suppress lipid accumulation [15]. There is in vitro evidence of an effect of quercetin on the energetics of isolated mitochondria [16].
Low-intensity prolonged exercise training simultaneously increases the activity of skeletal muscle mitochondrial enzymes involved in the tricarboxylic acid cycle and fatty acid ╬▓-oxidation [17]. Previous studies have demonstrated that PGC-1╬▒ is expressed in several tissues, including skeletal muscle and brown adipose tissue. PGC-1╬▒ increases mitochondria biogenesis and fatty acid oxidative metabolism [18]. In rats, PGC-1╬▒ mRNA and protein levels increase after a single bout of exercise as well as after several days of training [19].
It is generally accepted that the majority of the pleiotropic effects of long-term HFD is accompanied with changes in gene expression profiles. Several genes that encode enzymes or signal mediators involved in lipid and glucose metabolism respond to long-term HFD. For example, acyl-CoA oxidase (ACOX) and uncoupling protein-2 genes are altered in livers of long-term HFD mice, accompanied by an increase in the mRNA level of sterol regulatory element binding protein-1 (SREBP-1), the major transcriptional regulator for lipogenic genes [20].
Chronic exercise improves the capacity to utilize fatty acids by a coordinated upregulation of proteins involved in sarcolemmal uptake (fatty acid translocase), mitochondrial transport [carnitine palmitoyl transferase 1 (CPT1)] and ╬▓-oxidation (hydroxyacyl-coenzyme-A) of fatty acids [21]. Muscle AMP-activated protein kinase (AMPK) is stimulated during contraction, and may mediate multiple beneficial effects of exercise, specifically by increasing fatty acid oxidation and glucose uptake and promoting mitochondrial biogenesis. Malonyl-CoA is a potent allosteric inhibitor of CPT1, the rate-limiting enzyme that transfers long-chain acyl-CoA into mitochondria for ╬▓-oxidation [22].
Several studies have shown the effect of quercetin supplementation or exercise training separately, However, the synergistic effect of quercetin supplementation and exercise training has not been investigated after strenuous exercise as an oxidative stress. The aim of the present study was to investigate the effect of moderate exercise training and quercetin supplementation on inflammatory cytokine production, mitochondria biogenesis, and lipid metabolism after strenuous exercise in skeletal muscle of HFD mice.
METHODS
Animals care and diet
Male C57BL/6 mice (5-weeks-old) were purchased from Chungang Laboratory Animals (Seoul, Korea) and were housed in standard cages placed in a room at 22 ┬▒ 2.0┬░, 55 ┬▒ 10% relative humidity, and a 12 hour-light/12hour-dark cycle. All mice consumed a commercial diet and tap water ad libitum for 1 week.
Mice were randomly divided into four groups:(1) HFD for 12 weeks and low-fat diet for 8 weeks control (C; n = 6); (2) HFD for 12 weeks and low-fat diet for 8 weeks with quercetin (Q; n = 4); (3) HFD for 12 weeks and low-fat diet for 8 weeks with exercise (E; n = 4); or (4) HFD for 12 weeks and low-fat diet for 8 weeks with exercise and quercetin (EQ; n = 5). The mice were weighed every 2 weeks during the experimental period. Commercially available dried quercetin dihydrate (Sigma, St. Louis, MO, USA; Ōēź 98% purity by high-performance liquid chromatography) was used and dissolved in 50% propylene glycol. The control (C) and exercise (E) groups were orally administrated 100 ┬Ąl of propylene glycol as a vehicle. The quercetin (Q) and exercise with quercetin (EQ) groups were orally gavaged with quercetin (10 mg/kg body weight) dissolved in 50% propylene glycol. Each treatment was administered once per day, 5 days/week for 8 weeks. All treatments were performed 1 h after exercise.
Exercise protocol
Exercise training was performed on a motor treadmill at moderate intensity for 8 weeks, 5 days/week for 30-60 min/day during the dark cycle. This exercise intensity corresponds to 65-70% of maximal oxygen uptake. Just before killing the mice, they performed 60 min of treadmill exercise at a speed of 25 m/min (VO2 max 85%) to induce fatigue [23]. To control for any stress associated with the training protocol, animals in the control and quercetin groups were exposed to the same noise and handling as the exercise groups.
Tissue preparation
The animals were sacrificed by cervical dislocation 24 hours after strenuous exercise training. Skeletal muscle (tibialis anterior, soleus muscle) tissue were stored at -70┬░C until analysis.
RNA extraction and semi quantitative reverse transcription-polymerase chain reaction (RT-PCR)
Total RNA was isolated from the skeletal muscle tissue of each mouse using Trizol (Invitrogen, Carlsbad, CA, USA), and reverse-transcribed using the Superscript II kit (Invitrogen), according to the manufacturerŌĆÖs recommendations. The forward (F) and reverse (R) primers for the mice genes are shown in Table 2. The PCR was programmed as follows: 10 min at 94┬░C, 30-35 cycles of 94┬░C for 30 s, 55┬░C for 30 s; 72┬░C for 1 min, and 10 min incubation at 72┬░C. A 4 ┬Ąl aliquot of each PCR reaction was mixed with 1 ┬Ąl fivefold-concentrated loading buffer and was loaded onto 1% agarose gel containing ethidium bromide. PCR band density measurements were made with by Image Lab 4.0 (Bio-Rad, Hercules, CA, USA).The mRNA levels were normalized to the ╬▓-actin mRNA levels.
Statistical methods
The data was analyzed using of SPSS ver. 18.0 (SPSS, Inc., Chicago, IL, USA) to obtain means ┬▒ standard deviations. Body weights among the four groups were analyzed by repeated-measures analysis of variance (ANOVA). To investigate the effects of moderate exercise and quercetin intake on inflammation, mitochondrial biogenesis, and lipid metabolism after strenuous exercise in skeletal muscle, all groups were compared with a two-way ANOVA. The differences were consi-dered statistically significant at ╬▒ = 0.05.
RESULTS
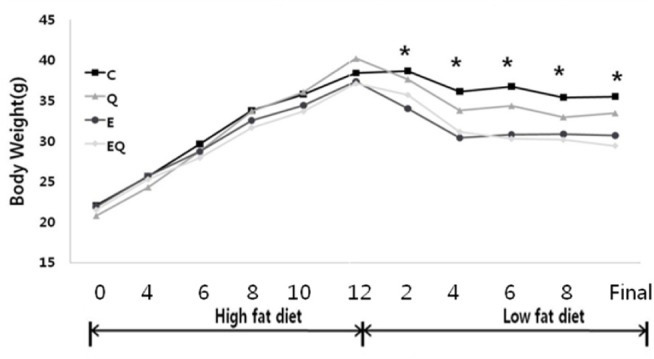
Body weight change
Body weights were significantly different among the groups (group effect, p = 0.001; group ├Ś time interaction, p = 0.001). Exercise training had a significant effect on final body weight, whereas the quercetin supplement had no effect on final body weight. No interaction was detected between exercise and quercetin treatment for final body weight.
Inflammatory cytokines
IL-6 mRNA expression
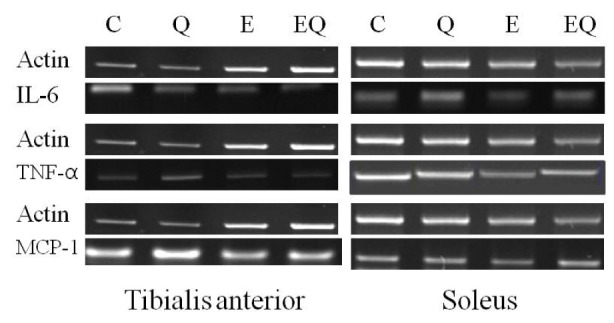
Exercise training had a significant effect on IL-6 mRNA expression in tibialis anterior muscle. However, quercetin supplementation had no effect on IL-6 mRNA expression in tibialis anterior and soleus muscles. The interactions between exercise and quercetin treatment were not significantly different for IL-6 mRNA expression in the tibialis anterior and soleus muscles (Table 4 and Fig. 2).
TNF-╬▒ mRNA expression
Exercise training had significant effects on TNF-╬▒ mRNA expression in tibialis anterior and soleus muscle, whereas quercetin did not. The interactions between exercise and quercetin treatment were not significantly different in TNF-╬▒ mRNA expression in tibialis anterior and soleus muscle (Table 5 and Fig. 2).
Monocyte chemoattractant protein-1 (MCP-1) mRNA expression
Exercise training had significant effects on MCP-1 mRNA expression in the tibialis anterior and soleus muscle, whereas quercetin supplementation did not. The interactions between exercise and quercetin treatment were not significantly different for MCP-1 mRNA expression in the tibialis anterior and soleus muscle (Table 6 and Fig. 2).
Mitochondrial biogenesis
Peroxisome proliferator-activated receptor-gamma coactivator 1 (PGC-1) mRNA expression
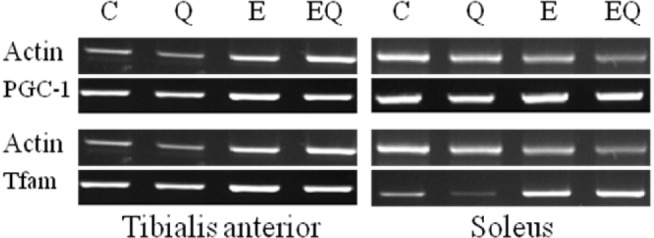
Exercise training had significant effects on PGC-1 mRNA expression in soleus muscle. However, quercetin supplementation had no effect. Interactions between exercise and quercetin treatment were not significantly different for PGC-1 mRNA expression in tibialis anterior and soleus muscles (Table 7 and Fig. 3).
Tfam mRNA expression
Exercise training and quercetin supplement did not significantly affect the mitochondrial transcription factor Tfam mRNA expression in tibialis anterior and soleus muscle. The interactions between exercise and quercetin treatment were not significantly different for Tfam mRNA expression in tibialis anterior and soleus muscle (Table 8 and Fig. 3).
Lipid metabolism
Lipolysis marker ;
ACOX mRNA expression
Exercise training had significant effects on ACOX mRNA expression in tibialis anterior muscle, whereas quercetin supplementation did not. The interactions between exercise and quercetin treatment were not significantly different in ACOX mRNA expression in tibialis anterior and soleus muscle (Table 9 and Fig. 4).
Lipogenesis markers
MCD mRNA expression
Exercise training had a significant effect on MCD mRNA expression in tibialis anterior muscle, whereas quercetin supplementation did not. The interactions between exercise and quercetin treatment were not significantly different in MCD mRNA expression in the tibialis anterior and soleus muscle (Table 10 and Fig. 4).
SREBP-1 mRNA expression
Exercise training had a significant effect on SREBP-1 mRNA expression in tibialis anterior and soleus muscle, whereas quercetin supplementation did not. The interactions between exercise and quercetin treatment were not significantly different in SREBP-1 mRNA expression in tibialis anterior and soleus muscle(Table 12, Fig. 4).
DISCUSSION
Calorie restriction and exercise are both effective at improving insulin sensitivity and decreasing body weight, percent body fat, and inflammation [24-26]. The final body weights were significantly reduced in the three treatment groups compared to that in the control. Most of the dietary and exercise weight loss studies show the magnitude of decrease in inflammatory markers to be linearly related to the amount of weight lost [27]. Several markers of inflammation, including C-reactive protein, IL-6, TNF-╬▒, and TNF-╬▒ receptors decrease after weight loss achieved through short-term intense dietary restriction [28]. Quercetin reduces macrophage expression of TNF-╬▒, IL-1╬▓, and IL-6 in a dose-dependent manner by inhibiting lipopolysaccharide-induced expression of these pro-inflammatory cytokines [29]. The decrease in skeletal muscle inflammatory cytokines (IL-6, TNF-╬▒, and MCP-1) in the Q group was influenced by quercetin intake. Nevertheless, quercetin (Q and EQ) had no significant effect on inflammatory cytokine (IL-6, TNF-╬▒, and MCP-1) expression in skeletal muscle.
Many studies have linked exercise to changes in cytokine levels. Regular physical activity results in a reduced inflammatory state, Pedersen [30], suggested that regular exercise modulates some pro-and anti-inflammatory cytokines, induces suppression of TNF-╬▒ and thereby offers protection against exacerbated inflammation. In contrasts, strenuous exercise induces an increase in the pro-inflammatory cytokines TNF-╬▒ and IL-1╬▓ and a dramatic increase in the inflammation responsive cytokine IL-6 [31]. We showed that moderate exercise after strenuous exercise with weight loss decreased IL-6, TNF-╬▒, and MCP-1 mRNA expression in the tibialis anterior muscle. Additionally, TNF-╬▒, and MCP-1 showed decreased mRNA expression in soleus muscle. There is controversy regarding skeletal muscle fiber types and production of IL-6 [32], as IL-6 accumulates equally in both type 1 and type 2 fibers.
Our results on IL-6 levels are in agreement with those reported after long-term antioxidant supplementation in individuals performing moderate exercise [33], indicating that moderate antioxidant supplementation does not affect immune adaptive mechanisms of long-term exercise.
PGC-1╬▒ plays an important role stimulating mitochondrial biogenesis following physiological demands and nutritional input, such as exercise or the dietary flavonoid resveratrol [34,35]. Endurance exercise induces an increase in muscle mitochondria [36]. A single bout of exercise stimulates mitochondrial biogenesis, as evidenced by increases in the expression of mitochondrial proteins [37]. The mechanism by which an increase in muscle mitochondria increases exercise capacity and endurance is by reducing the disturbance in metabolic homeostasis during sub-maximal exercise. Repeated bouts of exercise maintain this effect. Endurance exercise induces an increase in PGC-1╬▒ protein content in the nucleus without causing any change in the total PGC-1╬▒ protein level immediately after 2 hours of swimming in rats [38]. In this study, the exercise group showed increased the PGC-1 expression in skeletal muscle. Nevertheless, there was not main effect of exercise training (E and EQ).
Exercise increases the expression and function of Tfam in muscle in both animals and humans. One week of chronic contractile activity of rat muscle led to an increase in Tfam mRNA level after 4 days, an accelerated protein import into the matrix, an increase in Tfam-mtDNA binding and elevated mtDNA transcript levels encoding cytochrome c oxidase (COX) subunit III, and a higher COX enzyme activity by day 7 [39]. An increase in Tfam mRNA levels indicates that mitochondrial biogenesis responded to exercise; however, the lack of change in mitochondrial subunits indicates that the mitochondrial biogenesis response may have been blocked downstream of Tfam. In the present study, the main effect of endurance exercise training for the fast-twitch tibialis anterior muscle was a tendency to increase the mitochondrial biogenesis (PGC-1 and Tfam) as well as in the slow-twitch soleus muscle.
These findings suggest that the mechanisms regulating the moderate exercise-induced activation of PGC-1 and Tfam mRNA expression in muscle may be adaptive to exercise with endurance exercise.
Previous research examining the effect of polyphenols supplementation showed significantly up-regulated the acyl-CoA oxidase (ACO) mRNA level in epididymal fat [40]. In our study, quercetin group showed increased ACOX expression in skeletal muscle. Nevertheless, there was no main effect of the quercetin group (Q and EQ). However, there was a main effect of the exercise group (E and EQ).
Voluntary treadmill running exercise increase only AMPK2 activity in rat skeletal muscle, which is accompanied by increased glucose transport and ACC phosphorylation [41]. The net effect of these changes in kinetic properties is a decrease in ACC activity (i.e., lower rate of malonyl-CoA synthesis), particularly at citrate concentrations found in the muscle. SREBP-1 is a proximal transcription factor that increases lipogenic capacity, because it can be up-regulated by hyperinsulinemia induced by over-nutrition [42].
Previous research examined the effect of a single bout of exercise on up-regulating SREBP-1c [43]. According to research by Pawel et al. [44], SREBP-1c expression and SREBP-1 protein levels are not affected by exercise training. In our study, the exercise group showed increased SREBP-1 expression in skeletal muscle.
The exercise groups (E and EQ) had significant differences in lipolysis (ACOX) and lipogenesis (MCD and SREBP-1) gene expression in tibialis anterior muscle. Additionally, the exercise groups (E and EQ) showed significant differences in lipogenesis (MCD and SREBP-1) expression in soleus muscle. Exercise reduced lipogenesis and increased lipolysis. These results show differences between type I and type II muscles.
In conclusion, during the training period, muscles experienced changes in mRNA expression that brought about adaptation to aerobic exercise. Therefore, we believe that the strenuous exercise caused less metabolic stress in the exercise group, as indicated by the lack of an increase in ACOX mRNA in response to the strenuous exercise. Exercise (moderate and strenuous exercise) plays an important role increasing fatty acids and decreasing fatty acid synthesis; thereby, decreasing body weight benefiting lipid metabolism.